该板块暂无内容。
内容稍后补充。
1二项分布The Binomial distribution
阶乘Factorials
n 个对象排成一行的排列共有 n! 种,即 n 的阶乘。
注意 0! 定义为 1。这与组合的各个公式一致。
组合Combinations
从共 n 个对象中选出 r 个对象,若不计次序,则这种选法的数目称为「组合数」,并记作
可以把它理解为从 n 个中选 r 个。
Example:Find the number of hands of 4 cards which can be dealt from a pack of 10.
Solution:In a hand of cards the order does not matter, so this is just the number of combinations of 4 from 10, or 10 choose 4
notice 4 numbers on top of the fraction
nCr 的性质Properties of nCr
1.
nC0 = nCn = 1
2.
nCr = nCn–r
选出 r 个的选法数,与余下 n – r 个不必选的选法数相同。
二项式定理Binomial Theorem
二项系数Binomial coefficients
可以证明
这里的数 1, 3, 3, 1 称为二项系数,它们正是帕斯卡三角中「第三行」的数。
要写出 (p + q)6 的展开式
按逻辑顺序写出各项
p6 p5q p4q2 p3q3 p2q4 pq5 q6
再用三角形中「第 6 行」的数
1 6 15 20 15 6 1
二项系数与组合Binomial coefficients and combinations
nCr 也常写作 nr,它给出的正是帕斯卡三角中「第 n 行」的数。
于是有
4C0 = 40 = 14C1 = 41 = 44C2 = 42 = 64C3 = 43 = 44C4 = 44 = 1二项分布 B(n, p)Binomial distribution B(n, p)
二项分布成立的条件Conditions for a Binomial Distribution
1)
单次试验恰有两个可能的结果 —— 成功与失败。
2)
该试验重复进行固定的次数 n。
3)
这 n 次试验彼此独立。
4)
每次试验中成功的概率 p 保持不变。
单次试验中成功的概率通常记作 p,失败的概率记作 q。
注意 p + q = 1。
Example:10 dice are rolled. Find the probability that there are 4 sixes.
Solution:If X is the number of sixes then X ∼ B10, 16
We could have 6,6,6,6,×,×,×,×,×,×, in that order with probability 164566 × is ‘not 6’
or 6, ×,×,×,6, 6,×, ×,6,× , or 6,6,×,×,6,×,×,×,6,×, or ……….. all with probability 164566
The 4 sixes could appear on the 10 dice in a total of 10C4 ways, each way having the same probability, giving
using calculator
In general, for X ∼ B(n, p)
the probability of r successes is
二项分布Binomial distribution
二项分布表 X ∼ B(n, p) 如下所示。
| x | 0 | 1 | 2 | ... | r | ... | n |
| P(X = x) | nC0qn | nC1pqn-1 | nC2p2qn-2 | ... | nCrprqn – r | ... | nCnpn |
注意「概率分布」一词指的是全部可能结果的集合(这里即 x = 0, 1, 2, …, n),连同它们各自的概率;它也可以指一张概率表。
Example:A game of chance has probability of winning 0⋅73 and losing 0⋅27. Find the probability of winning more than 7 games in 10 games.
Solution:The number of successes is a random variable X ~ B(10, 0⋅73), assuming independence of trials.
using calculator
累积二项概率表Cumulative binomial probability tables
Example:For X ~ B(30, 0⋅35), find the probability that 7 < X ≤ 12.
Solution:A moment’s thought shows that we need P(X = 8, 9, 10, 11 or 12)
using tables for n = 30, p = 0⋅35
4 D.P. as we are using tables
Example:A bag contains a large number of red and white discs, of which 85% are red. 20 discs are taken from the bag; find the probability that the number of red discs lies between 12 and 17 inclusive.
Solution:As there is a large number of discs in the bag, we can assume that the probability of a red disc remains the same for each trial, p = 0⋅85.
At first glance this looks simple until we realise that the tables stop at probabilities of 0⋅5.
it is worth writing out the numbers
since X + Y = 20
from tables
二项分布的均值与方差Mean and variance of the binomial distribution.
若 X ~ B(n, p),则
期望均值是
E[X] = µ = np,
期望方差是
Var[X] = σ2 = npq = np(1 – p).
这意思是:如果把这一组 n 次试验重复非常多次,并记下每一次的成功次数 x1, x2, x3, x4 … …,
那么这些值的
均值
x1, x2, x3, x4 ... … would be µ = np
以及这些值的
方差
x1, x2, x3, x4 ... … would be σ2 = npq
这些公式在附录中给出证明。
Example:A coin is spun 100 times. Find the expected mean and variance of the number of heads.
Solution:X ∼ B(100, 12)
So we would expect that the probability that the number of heads lies between 40 and 60 inclusive (within 2 standard deviations of the mean) is about 0⋅95.
Example:It is believed that 35% of people like fish and chips. A survey is conducted to verify this. Find the minimum number of people who should be surveyed if the expected number of people who like fish and chips is to exceed 60.
Solution:If X is the number of people who like fish and chips in a sample of size n,
2泊松分布The Poisson distribution
泊松分布成立的条件Conditions for a Poisson distribution
事件的发生必须满足:
1)
单个发生
– 两个事件不能同时发生
2)
均匀发生
– 事件以恒定速率发生
3)
独立且随机
– 一个事件的发生不影响另一个事件的发生
示例:
a) 放在放射源附近的盖革计数器上的闪烁
单个发生
– 在极短的时间间隔内,出现一次闪烁的概率很小,而出现两次的概率可以忽略不计。
均匀发生
– 在“较长”的一段时间内,我们预期闪烁以恒定速率出现
独立发生
– 一次闪烁不影响另一次闪烁。
b) 巧克力豆冰淇淋中巧克力豆的分布
单个发生
– 在一小块冰淇淋中,出现一颗巧克力豆的概率很小,出现两颗的概率可以忽略不计。
均匀发生
– 在“较大”且大小相同的冰淇淋块中,我们预期巧克力豆的数目大致恒定(前提是混合物已被充分搅拌)。
独立发生
– 一颗巧克力豆的存在不影响另一颗的存在。
c) 玻璃棒生产中的缺陷
单个发生
– 在一小段玻璃棒中,出现一个缺陷的概率很小,出现两个的概率可以忽略不计。
均匀发生
– 在“较大”且等长的同规格玻璃棒段中,我们预期缺陷的数目大致恒定(前提是玻璃熔液已被充分搅拌)。
独立发生
– 一个缺陷的存在不影响另一个缺陷的存在。
泊松分布Poisson distribution
在某个特定长度的区间内,若泊松分布的均值为 λ,则在同一长度的区间内出现 r 次的概率为
这些概率的证明见附录
X ∼ Po(λ) 的泊松分布(表)如下所示。
| x | 0 | 1 | 2 | ... | r | ... |
| P(X = x) | e−λ | λe−λ | λ2e−λ2! | ... | λre−λr! | ... |
如前所述,「概率分布」一词的意思是
全部可能结果的集合(这里即 x = 0, 1, 2, …, n 的各个取值),
连同它们各自的概率;它也可以指一张概率表。
注意:在泊松分布中,x 可以取任意非负整数,无论多大。但在实际中,取值“较大”时的概率会非常非常小。
求泊松分布的概率,与求二项分布的概率非常相似 ——
而泊松的累积概率表,用法与二项分布的类似。
Example:Cars pass a particular point at a rate of 5 cars per minute.
(a) Find the probability that exactly 4 cars pass the point in a minute.
(b) Find the probability that between at least 3 but fewer than 8 cars pass in a particular minute.
(c) Find the probability that more than 8 cars pass in 2 minutes.
(d) Find the probability that more than 3 cars pass in each of two separate minutes.
Solution:Let X be the number of cars passing in a minute, then X ∼ Po(5)
(a) X ∼ Po(5)
using calculator
or
using tables
(b) P(at least 3 but fewer than 8) = P(3 ≤ X < 8)
using tables
(c) We know that the Poisson distribution is uniform, so if a mean of 5 cars pass each minute,
it means that a mean of 10 cars pass in a 2 minute period.
Thus, if Y is the number of cars passing in two minutes
using tables
(d) For probability of more than 3 in one 1 minute period, we have X ∼ Po(5)
from tables
using calculator
Notice the difference in the parts (c) and (d). Make sure that you read every question carefully‼
泊松分布的均值与方差Mean and variance of the Poisson distribution.
若 X ~ Po(λ),则可以证明
期望均值为
期望方差为 Var[X] = σ2 = λ.
这意味着,如果把 n 次试验重复非常多次,并记录每次的出现次数 x1, x2, x3, x4 ... …
那么
而
注意:在泊松分布中,均值等于方差。
Example:In producing rolls of cloth there are on average 4 flaws in every 10 metres of cloth.
(a) Find the mean number of flaws in a 30 metre length.
(b) Find the probability of fewer than 3 flaws in a 6 metre length.
(c) Find the variance of the number of flaws in a 15 metre length.
Solution:Assuming a Poisson distribution – flaws in the cloth occur singly, independently,
uniformly and randomly.
(a) If the mean number of flaws in 10 metres is 4,
then the mean number of flaws in 30 metre lengths is 3 × 4 = 12.
(b) If there are 4 flaws on average in a 10 metre length there will be 610 × 4 = 2⋅4 flaws on
average in a 6 metre length.
If X is the number of flaws in a 6 metre length then X ∼ Po(2.4).
using calculator
(c) If the mean number of flaws in 10 metre lengths is 4, then the mean number of flaws in 15
metre lengths will be
Since, in a Poisson distribution, the variance equals the mean
the variance in 15 metre lengths is 6.
泊松分布作为二项分布的近似The Poisson as an approximation to the binomial
二项分布 B(n, p),当 p 或 q 很小时Binomial B(n, p) for small p or q
在二项分布 X ∼ B(n, p) 中,若 p 很“小”而 n 很“大”,则可用均值为 λ = np 的泊松分布来近似,即 X' ∼ Po(np)。
而若 p 接近 1,则 q 会很小;此时 Y ∼ B(n, q),其中 Y = n − X,可以用泊松分布 Y' ∼ Po(nq) 来近似
注意,当 p 很“小”而 n 很“大”时,
实际使用这个近似,是在 p(或 q)很小且 np ≤ 10 的时候,
而当 np > 10 时,我们改用正态近似(见后文)。
Example:If the probability of hitting the bull in a game of darts is 120, find the probability of hitting
at least 3 bulls in 50 throws using
(a) the Binomial distribution
(b) the Poisson approximation to the Binomial.
Solution:P(at least three bulls) = 1 – P(0, 1 or 2) = 1 – P( ≤ 2).
(a) For X ∼ B(50, 0⋅05) the cumulative binomial tables give
using tables
(b) X ∼ B(50, 0⋅05) the expected mean λ = np
We use the approximation Y ∼ Po(2.5).
The cumulative Poisson tables for λ = 2.5 give
using tables
Not surprisingly the answers to parts (a) and (b) are different but not very different.
选择合适的分布Selecting the appropriate distribution
有时你需要混合使用多种分布来解决同一个问题。
Example:On average I make 7 typing errors on a page (and that is on a good day!).
(a) Find the probability that I make more than 10 mistakes on a page.
(b) In typing 5 pages find the probability that I make more than 10 mistakes on exactly 3 pages.
Solution:
(a) Assuming single, uniform and independent/random we can use the Poisson distribution
Po(7) and from the cumulative Poisson tables, taking X as the number of typing errors
(b) From (a) we know that the probability of one page with more than 10 errors is 0.0985 and
we take Y as the number of pages with more than 10 errors. Thus for 5 pages
using calculator
3连续随机变量Continuous random variables
概率密度函数Probability density functions
对于连续随机变量,我们使用概率密度函数来代替离散取值所用的概率分布。
条件Conditions
连续随机变量 X 具有概率密度函数 f (x),如图所示,其中
- 总面积为 1 ⇒ ∫ f(x) dx = 1
- 曲线永不低于 x 轴 ⇔ f (x) ≥ 0 对 x 的一切取值成立
- X 落在 a 与 b 之间的概率是从 a 到 b 的面积
- 在所示区间之外,f (x) = 0,这必须在任何草图上标出 —— 见红线。
- 注意 P(X < b) = P(X ≤ b),因为没有额外的面积。
- P(X = b) 总是等于 0(因为没有面积),但这并不意味着 X 永远不能等于 b。
Example: X is a random variable with probability density function
(a) Find the value of k.
(b) Find the probability that 12 < x ≤ 1.
(c) Sketch the probability density function.
Solution:
(a) The total area between 0 and 2 must be 1
(b) The probability that 12 < x ≤ 1 is the area between 12 and 1
using calculator
(c) Note that f (x) is zero outside the interval [0, 2] and this
must be shown on your sketch to gain full marks in the exam.
累积概率密度函数Cumulative probability density function
这类似于累积频数;
累积概率密度函数 F(X) = P(x < X) or P(x ≤ X) 。
注意对于连续分布,这两个表达式没有区别。
所以对于概率密度函数 f (x)
注意对于累积概率密度函数 F(X), 0 ≤ F(X) ≤ 1。
对于 x 的「最小」值,F(x) = 0,而对于 x 的「最大」值,F(x) = 1。
Example: The random variable X has probability density function
Find the cumulative probability that X ≤ 3, i.e. find F(3).
Solution: We want F(3) = P(x ≤ 3)
Notice that we could have drawn a sketch
and found the area of the triangle
Example: A random variable X has a probability density function
(a) Find F(x).
(b) Sketch the graph of F(x).
Solution:
(a) F(x) = ∫ f(x) dx
0 ≤ x < 1
1 ≤ x < 3
Finding c′ is more complicated here.
The interval [0, 1) ends with F(1) = 110× 13 = 110,
and so the interval [1, 3) must start with F(1) = 110.
3 ≤ x < 5
(b)
Example: A dart is thrown at a dartboard of radius 25 cm. Let X be the distance from the centre to
the point where the dart lands.
Assuming that the dart is equally likely to hit any point of the board find
(a) the cumulative probability density function for X.
(b) the probability density function for X.
Solution:
(a) F(x) = P(X < x) = P(the dart lands a distance of less than x from the centre)
(b) f(x) = d(F(x))dx = ddx ( x2625 ) = 2x625
期望值与方差Expected mean and variance
频率分布、离散与连续概率分布Frequency, discrete and continuous probability distributions
要把频率分布变成离散概率分布,可把每个概率 pi 看作 fiN;
而要把离散概率分布变成连续分布,可把 x 处的概率看作 x 附近一条窄条的面积。
于是均值与方差等公式「形式相同」。
三者的对应关系如下表:
| 频率分布 | 离散概率分布 | 连续概率分布 |
|---|---|---|
| x1, x2, ... , xn | x1, x2, ... , xn | -∞ < x < ∞ |
| f1, f2, ... , fn | p1, p2, ... , pn | f(x) |
| ∑ fi = N | ∑ pi = 1 | ∞∫−∞ f(x) dx = 1 |
| m = 1N ∑ xifi | µ = ∑ xipi | µ = ∞∫−∞ x f(x) dx |
| s2 = 1N ∑ xi2fi − m2 | σ2 = ∑ xi2 pi − µ2 | σ2 = ∞∫−∞ x2 f(x) dx − μ2 |
| = 1N ∑ (xi − m)2 | = ∑ (xi − µ)2 pi | = ∞∫−∞ (x − µ)2 f(x) dx |
连续随机变量的众数、中位数与四分位数Mode, median & quartiles for a continuous random variable
众数Mode
众数是最「常见」的值,因此位于区间内 f (x) 的最大值处。
最好先画出草图,必要时用微积分求驻点。
记住:众数可能在区间的一端,而不在中间。
Example: Find the mode for a random variable with probability density function
Solution:
We now look at the whole graph in the interval
中位数Median
中位数是中间值,因此小于中位数的概率为 ½;即求 M 使 P(X < M) = 12。
Example: Find the median for a random variable with probability density function
Solution: The median M is given by
四分位数Quartiles
四分位数的求法与中位数相同。
4连续均匀(矩形)分布Continuous uniform (rectangular) distribution
定义Definition
连续均匀分布在固定区间上具有恒定的概率密度。
因此 f (x) = 1β−α 是区间 [α, β] 上的连续均匀概率密度函数,其图形呈矩形。
中位数Median
由对称性,中位数为 α + β2。
期望与方差Mean and Variance
期望为 E[X] = µ = α + β2,与中位数相同。
方差为 Var[X] = σ2 = (β−α)212。
这些公式在附录中给出证明。
5正态近似Normal Approximations
二项分布的正态近似The normal approximation to the binomial distribution
近似的条件Conditions for approximation
对二项分布 B(n, p),已知均值为 µ = np,方差为 σ2 = npq。
若 p 「接近」 12,且若 n 很大、np > 10,则正态分布 N(np, npq) 可作为二项分布的近似。
当用二项分布计算会得到繁琐或冗长的算术时,通常就用它。
关于二项分布正态近似的证明,见附录。
连续性修正Continuity correction
用正态分布近似二项分布时,必须始终使用连续性修正
(这意味着 47 必须取作 46⋅5 或 47⋅5,取决于题目的方向。)
Example:Find the probability of more than 20 sixes in 90 rolls of a fair die.
Solution:The exact distribution is binomial X ∼ B90, 16, where X is the number of sixes; but
finding the exact probability would involve much tedious arithmetic.
Note that n is large, np = 15 > 10 so we can use the normal N(np, npq) as an approximation.
So we use Y ∼ N15, √12 ∙52, where Y is the number of sixes
To find P(more than 20 sixes) we must include 21
but not 20 so, using a continuity correction, we
find the area to the right of 20⋅5,
using tables
泊松分布的正态近似The normal approximation to the Poisson distribution
近似的条件Conditions for approximation
对泊松分布 Po(λ),已知均值为 µ = λ,方差为 σ2 = λ,且
若 n 很大且 λ > 10 则正态分布 N(λ, √λ2) 可作为泊松分布 Po(λ) 的近似。
当用泊松分布计算会得到繁琐或冗长的算术时,通常就用它。
连续性修正Continuity correction
与二项分布的正态近似一样,用正态分布近似泊松分布时,必须始终使用连续性修正。
Example:Cars arrive at a motorway filling station at a rate of 18 every quarter of an hour. Find the
probability that at least 23 cars arrive in a quarter of an hour period.
Solution:The exact distribution is Poisson
X ∼ PO(18), where X is the number of cars arriving in a 14 hour period;
but finding the exact probability would involve much tedious arithmetic.
Note that n is large, λ = 18 > 10 so we can use the normal Y ∼ N(18, 18), where Y is the
number of cars arriving in a ¼ hour period, as an approximation.
To find P(at least 23 cars) we must include 23 but not
22 so, using a continuity correction,
we find the area to the right of 22⋅5,
using tables
6种群与抽样Populations and sampling
词语与含义Words and their meanings
种群所有项目的集合。
有限总体 总体的一种,其中每个个体成员都能被编号(总体可能大到难以或不可能给每个成员编号 —— 例如海滩上的沙粒)。
无限总体
总体的一种,其中每个个体成员都不能被编号。
普查
对总体中每个成员都进行考察的调查。
抽样单元
总体中单个可被纳入样本的成员。
抽样框
由全部抽样单元按名称或编号列成的清单,样本即从中抽取(通常就是整个总体,但不一定)。
样本
从抽样框中选出的一组抽样单元。
简单随机样本
大小为 n 的简单随机样本是这样抽取的:使每一个大小为 n 的样本都有同等机会被选中。
样本中的成员是相互独立的随机变量 X1, X2, … , Xn ,且每个 Xi 都与总体具有相同的分布。
抽样调查
使用样本进行的调查。
统计量
仅由样本中的数据算出的量,不使用任何未知参数(例如 µ 和 σ)。
统计量的抽样分布
统计量的全部可能取值,连同它们各自的概率所构成的集合;有时用相应的概率密度函数来描述更好。
普查的优缺点Advantages and disadvantages of taking a census
优点
总体中的每个成员都被用到。
它是无偏的。
它给出精确的答案。
缺点
耗时长。
成本高。
往往难以确保整个总体都被调查到。
抽样的优缺点Advantages and disadvantages of sampling
优点
若总体很大且混合均匀,样本将具有代表性。
通常更便宜。
当检验具有破坏性时(灯泡的寿命等)必不可少。
数据通常更容易获得。
缺点:
不确定性,源于自然变异 —— 两个样本不太可能给出相同的结果。
源于偏倚的不确定性会使样本无法给出总体的代表性图景,其产生途径包括:
从不完整的抽样框中抽样 —— 例如用电话簿抽取曼谷(或任何大城市)的居民
受主观选择的影响 —— 所谓随机选择其实受个人偏好左右,例如只采访没有(凶)狗的人
无应答 —— 关于某家移动电话服务的问卷,许多不使用该服务的人并未作答
用便利的抽样单元替代 —— 当所需单元不易获得时,例如抽样单元不在家就改访邻居!
注意: 增大样本量并不能消除偏倚。
注意: 回答这些定义类题目时,可能要求你结合情境作答。
例:
抽样框是全部放大器及其序列号的一份清单。
抽样单元是一台放大器。
检验统计量是投给史密斯先生的票数。
样本是从学校中随机选出的学生。
普查是一项调查,其中记录所制造的全部杆件的长度。
抽样分布Sampling distributions
要求出 ****** 的抽样分布
我们需要 ****** 的全部可能取值,连同它们各自的概率
写出全部可能的样本及其概率
计算每个样本的 ****** 值
****** 的抽样分布,就是 ****** 的全部可能取值连同其概率的一份清单。
Example:A large bag contains £1 and £2 coins in the ratio 3 : 1.
A random sample of three coins is taken and their values X1, X2 and X3 are recorded.
Find the sampling distribution for the mean.
Solution:We must first find each sample, its mean and probability
| Sample | Mean | Probability |
| (1, 1, 1) | 1 | (3/4)3 = 27/64 |
| (1, 1, 2), (1, 2, 1), (2, 1, 1) | 113 | 3 × (3/4)2 × (1/4) = 27/64 |
| (1, 2, 2), (2, 1, 2), (2, 2, 1) | 123 | 3 × (3/4) × (1/4)2 = 9/64 |
| (2, 2, 2) | 2 | (1/4)3 = 1/64 |
and so the sampling distribution (or probability table) of the mean is
| Mean | 1 | 113 | 123 | 2 |
| Probability | 27/64 | 27/64 | 9/64 | 1/64 |
或者,你也可以改用标准概率分布。
Example:A disease is present in a 23% of a population. A random sample of 30 people is taken and
the number with the disease, D, is recorded. What is the sampling distribution of D?
Solution:The possible outcomes (values of D) are
| D | 0 | 1 | … | r | … | 30 |
| with probabilities | 0⋅7730 | 30C1.0⋅7729× 0.23… | 30Cr ×0⋅7730–r×0.23r | … | 0.2330 | |
which we recognise as the Binomial distribution,
so the sampling distribution of D is D ~ B(30, 0.23)
7假设检验Hypothesis tests
零假设 Null hypothesis, H0
除非被证明并非如此,否则就假定为正确的假设。
备择假设 Alternative hypothesis, H1
如果 H0 被拒绝,就应当得出的结论。
假设检验 Hypothesis test
一种数学程序:把零假设 H0 所提出的总体参数值与备择假设 H1 相比较,从而对前者进行考察。
检验统计量 Test statistic
由样本算出、并在显著性检验的最后一步接受检验(查累积概率表,或用正态分布等)的统计量。
拒绝域 Critical region
会导致你拒绝零假设 H0 的取值范围。
显著性水平 Significance level
实际显著性水平是「H0 实际上为真时却拒绝它」的概率。
零假设与备择假设,H0 与 H1Null and alternative hypotheses, H0 and H1
零假设与备择假设都只用符号表述。
零假设 H0 是「工作假设」,即为了进行检验而假定为真的命题。
备择假设 H1 是拒绝零假设后你所下的结论:它也决定了你用单尾检验还是双尾检验。
结论必须完整表述——既用统计语言,也结合题目情境。
假设与显著性水平Hypotheses and significance level
根据观察到的结果(检验统计量),你决定拒绝还是不拒绝零假设 H0。
在零假设 H0 之下,结果可能落在图上的任何位置——包括那些小的(蓝色)阴影区域。
如果观察到的结果(检验统计量)落在小的(蓝色)阴影区域,我们就说该检验统计量在 5% 水平上显著,或者说我们拒绝 H0。因此 H0 实际上可能为真,而我们仍然拒绝了它。
于是,显著性水平 5% 就是「H0 实际为真时拒绝 H0」的概率,也就是错误地拒绝 H0 的概率。
当我们拒绝零假设 H0 时,我们用备择假设来写结论。
拒绝域与显著性水平Critical regions and significance levels
泊松与二项Poisson and Binomial
泊松分布与二项分布都是离散的,我们看的是概率直方图。
图中,拒绝域(由阴影区域表示)是 X ≤ 12 或 X ≥ 20。
我们把 X = 12 和 X = 20 附近的整根柱子都包括进去。
因此 P(X ≤ 12) 是 12⋅5 左侧的面积,而 P(X ≥ 20) 是 19⋅5 右侧的面积。
若 P(X ≤ 12) = 0⋅0234 且 P(X ≥ 20) = 0⋅0217,则
实际显著性水平 为 0⋅0234 + 0⋅0217 = 0⋅0451 = 4⋅51%
因此,错误拒绝 H0 的概率是 0⋅0451,
或者说,在 H0 实际上为真时拒绝 H0 的概率是 0⋅0451。
单尾与双尾检验One-tail and two-tail tests
备择假设 H1 会指明你该用单尾检验还是双尾检验。
例如:
H0:a = b
H1:a > b
只有当 a 显著大于 b 时才拒绝 H0。
因此你只看总体的一端,单尾检验适用。
H0:a = b
H1:a ≠ b
无论 a 显著大于还是显著小于 b,你都会拒绝 H0。
因此你看的是总体的两端,双尾检验适用。
上述要点最好用例题说明。注意我们总是求「观察到该结果或更极端结果」的概率:这样就能一眼看出观察结果是否落在拒绝域内。
例题(二项,单尾检验)Worked examples (binomial, one-tail test)
Example:A tetrahedral die (one with four faces! – each equally likely) is rolled 40 times and 6 ‘ones’ are observed. Is there any evidence at the 10% level that the probability of a score of l is less than a quarter?
Notice that the expected mean is 10 (= 40 × 14), and we are really asking if the observed result
(test statistic) 6 is ‘surprisingly low’.
Solution:
H0:p = 0.25
H1:p < 0.25.
From H1 we see that a one-tail test is required, at 10% significance level.
If X is number of ‘ones’ then assuming binomial X ~ B(40, 0⋅25), from H0, and using the
cumulative binomial tables
The test statistic (observed value) is X = 6
P(X ≤ 6 ‘ones’ in 40 rolls) = 0⋅0962 = 9⋅62%from tables
Since 9⋅62% < 10% the test statistic (observed result) lies in the critical region.
We reject H0 and conclude that
there is evidence to show that the probability of a score of 1 is lower than
14.
Example:The probability that a footballer scores from a penalty is 0⋅8. In twenty penalties he scores only 13 times. Is there any evidence at the 5% level that the footballer is losing his form?
Solution:
H0:p = 0⋅8
H1:p < 0⋅8
If X is the number of scores from 20 penalties, then X ∼ B (20, 0⋅8) – from H0
The cumulative binomial tables do not deal with p > 0.5 so we must ‘turn the problem round’ and
consider Y, the number of misses in 20 penalties, where Y ∼ B (20, 0⋅2).
Observed value is X = 13
We consider the values X ≤ 13
Using the cumulative binomial tables, Y ∼ B (20, 0⋅2)
P(X ≤ 13) = P (Y ≥ 7)
= 1 – P (Y ≤ 6) = 1 – 0⋅9133 = 0⋅0867 = 8⋅67%
8⋅67% > 5% (significance level)
⇒ the test statistic (observed result) 7 is not significant (does not lie in the critical region),
Do not reject H0.
Conclude that there is evidence that the player has not lost his form, or that there is evidence that
the probability of scoring from a penalty is not less than 0⋅8.
例题(二项检验,双尾拒绝域)Worked example (binomial test, two-tail critical region)
Example:A tetrahedral die is manufactured with numbers 1, 2, 3 and 4 on its faces. The manufacturer claims that the die is fair.
All dice are tested by rolling 30 times and recording the number of times a ‘four’ is scored.
(a) Using a 5% significance level, find the critical region for a two-tailed test that the probability of a ‘four’ is 14.
Find critical values which give a probability which is closest to 0⋅025.
(b) Find the actual significance level for this test.
(c) Explain how a die could pass the manufacturer’s test when it is in fact biased.
Solution:
(a)
H0:p = 0⋅25.
H1:p ≠ 0⋅25 the die is not fair if there are too many or too few ‘fours’
From H1 we can see that a two-tailed test is needed, significance level 2⋅5% at each end.
Let X be the number of ‘4’s in 30 rolls. From H0 we have a binomial distribution, X ~ B(30, 0⋅25).
We shall reject the hypothesis if the observed result lies in either half of the critical region each
half having a significance level of 2⋅5%;
For a two tail test, find the values of X which give a probability closest to 2⋅5% at each end.
Using cumulative binomial tables for X ∼ B (30, 0⋅25):
for the lower critical valuefrom tables
P(X ≤ 2) = 0⋅0106 (2.5% – 1.06% = 1.44%)
P(X ≤ 3) = 0⋅0374 (3.74% – 2.5% = 1.24%)
X ≤ 3 gives the value closest to 2⋅5%, so X = 3 is lower critical value
and for the higher critical valuefrom tables
P(X ≥ 13) = 1– P(X ≤ 12) = 1 – 0.9784 = 0.0216 (2.5% – 2.16% = 0.34%)
P(X ≥ 12) = 1– P(X ≤ 11) = 1 – 0.9493 = 5.07% (5.07% – 2.5% = 2.57%)
X ≥ 13 gives the value closest to 2⋅5%, so X = 13 is higher critical value
Thus the critical region is X ≤ 3 or X ≥ 13.
(b)
The actual significance level is 0⋅0374 + 0⋅0216 = 0⋅0590 = 5⋅90%. to 3 S.F.
(c)
The die could still be biased in favour of, or against, one of the other numbers.
例题(泊松)Worked example (Poisson)
Example:Cars usually arrive at a motorway filling station at a rate of 3 per minute. On a Tuesday morning cars are observed to arrive at the filling station at a rate of 5 per minute. Is there any evidence at the 10% level that this is an unusually busy morning?
Solution:
H0:λ = 3
H1:λ > 3 unusually busy would mean that λ would increase
From H1 we see that a one-tail test is needed, significance level 10%.
It seems sensible to assume that the numbers of cars arriving per minute is independent, uniform
and single so a Poisson distribution is suitable.
Let X be the number of cars arriving per minute, then from H0, X ~ Po(3)
The test statistic (observed value) is X = 5
P(X ≥ 5) = 1 – P(X ≤ 4) = 1 – 0⋅8153 = 0⋅1847 = 18⋅47% > 10%using tables
which is not significant at the 10% level. Do not reject H0.
Conclude that there is evidence that Tuesday morning is not unusually busy,
or there is evidence that cars are not arriving at a rate greater than 3 cars per minute.
例题(泊松,拒绝域)Worked example (Poisson, critical region)
Example:Over a long period in the production of glass rods the mean number of flaws per 5 metres length is 4. A length of 10 metres is to be examined. Find the critical region to show that the machine is producing too many flaws at the 5% level.
Find the lowest value which gives a probability of less than 5%.
Solution:
H0:λ = 8 flaws occur uniformly, so if mean per 5 metres is 4, then mean per 10 metres is 8
H1:λ > 8 machine producing too many flaws would mean that λ would increase
We can see from H1 that we need a one- tail test, significance level 5%.
For a one tail test, find the first value of X for which the probability is less than 5%
It seems sensible to assume that the number of flaws per 10 metre lengths is independent, uniform
and single so a Poisson distribution is suitable, and using H0
X ~ Po(8) where X is the number of flaws in a 10 metre length
P(X ≥ 13) = 1 – P(X ≤ 12) = 1 – 0⋅9362 = 0⋅0638 = 6⋅38% > 5%from tables
P(X ≥ 14) = 1 – P(X ≤ 13) = 1 – 0⋅9658 = 0⋅0342 = 3⋅42% < 5%
X = 14 is the smallest value for which the probability is less than 5%
⇒ the critical region is X ≥ 14.
用近似做假设检验Hypothesis testing using approximations.
Example:With current drug treatment, 9% of cases of a certain disease result in total recovery. A new treatment is tried out on a random sample of 100 patients, and it is found that 16 cases result in total recovery. Does this indicate that the new treatment is better at a 5% level of significance?
Solution:Let X be the number of cases resulting in total recovery.
H0:p = 0.09 new treatment has same recovery rate as the current treatment
H1:p > 0.09 new treatment is better than the current treatment
X ~ B(100, 0.09), which is not in the tables and is awkward arithmetic, so we use an
approximation.
λ or µ = np = 100 × 0.09 = 9 < 10,
n large and p small ⇒ we should use the Poisson approximation Y ~ Po(9)
The test statistic is X = 16.
We want P (X ≥ 16) ≈ P (Y ≥ 16)
= 1 – P (Y ≤ 15) = 1 – 0⋅9780 = 0⋅0220 < 5%from tables
⇒ this result is significant at 5%
⇒ Reject H0.
Conclude that there is some evidence that the proportion of cases of total recovery has increased
from 0.09 under the new treatment.
Example:With current drug treatment, 20% of cases of a certain disease result in total recovery. A new treatment is tried out on a random sample of 100 patients, and it is found that 26 cases result in total recovery. Does this indicate that the new treatment is better at a 5% level of significance?
Solution:Let X be the number of cases resulting in total recovery.
H0:p = 0.2
H1:p > 0.2
X ~ B(100, 0.2), which is not in the tables and is awkward arithmetic,.
µ = np = 100 × 0.2 = 20 > 10,
n large and p is ‘near’ 0⋅5
so we use a normal approximation.
σ2
= np(1 – p) = 100 × 0.2 × 0.8 = 16
Use the approximation Y ~ N (20, 42)
The test statistic is X = 26.
We want P (X ≥ 26) ≈ P (Y ≥ 25⋅5)you must use a continuity correction
= P ( Z ≥ 25∙5−204 ) = 1 −P(Z ≥ 1 ∙375) (use Z = 1⋅38)
= 1 – 0⋅9162 = 0⋅0838 > 5%
⇒ the result is not significant at 5%
⇒ Do not reject H0.
Conclude that there is evidence that the proportion of cases of total recovery has not increased
from 0⋅2 under the new treatment,
or conclude that there is evidence that the new treatment is not better.
8情境题与解答Context questions and answers
精确度Accuracy
题目要求你按恰当的有效数字给出答案。
这一点没有硬性规定,但下面几条准则不会让你失手。
- 用计算器时,给 3 位有效数字(S.F.);但求 Sxx、Sxy 这类量时除外——这种情况下可以多保留几位,求 PMCC 或回归直线系数时应当用上全部数字。
- 有时把均值给到 1 位或 2 位小数(D.P.)比给 3 位有效数字更合适。
- 查表并做简单计算时(这类计算不需要计算器),应给 4 位小数(D.P.)。
通用词汇General vocabulary
答题时,凡是需要的地方都必须写出具体情境;只写定义是不够的。
Question 1
Explain what you understand by the statistic Y.
Answer
A statistic is a calculation from only the values in the sample, X1, X2,...Xn that does not contain any unknown parameters.
Question 2
A random sample is taken of the heights of 20 people living in a small town. The mean height, 163 cm, is calculated. Why can the number 163 be considered as a statistic?
Answer
163 is the mean height of the 20 people in the sample, and can be calculated only using the heights in the sample.
Question 3
The number of hurricanes in a two month period follows a Poisson distribution.
Based on the null hypothesis that the mean number of hurricanes in two months is 7, the critical values, at 5% significance level, are 2 and 12. The number of hurricanes, n, in a two month period is then recorded
What is the test statistic, and what is meant by the critical region.
Answer
The test statistic is n, the number of hurricanes in a two month period, and the critical region, X ≤ 2 or X ≥ 12, is the range of values of n, the number of hurricanes in a two month period, which would lead to the rejection of H0.
Question 4
Explain what you understand by
| (a) | a population, |
| (b) | a statistic. |
A researcher took a sample of 100 voters from a certain town and asked them who they would vote for in an election. The proportion who said they would vote for Dr Smith was 35%.
| (c) | State the population and the statistic in this case. |
| (d) | Explain what you understand by the sampling distribution of this statistic. |
Answer
| (a) | A population is a collection of all items |
| (b) | A calculation only from the sample which contains no unknown quantities/parameters. |
| (c) | The population is ‘voters in the town’. The statistic is ‘percentage/proportion voting for Dr Smith’. |
| (d) | List of all possible samples (of size 100) of those voting for Dr Smith together with the probability of each sample. In this case the sampling distribution is B(100, 0⋅35) |
偏度Skew
Question 1
In a sample of the lengths of 40 worms, the lower quartile was 8 cm, the median was 16 cm and the upper quartile was 27 cm. The length of the shortest worm was 5 cm, and the longest was 34 cm. Describe the skewness of the sample. Give a reason for your answer.
Answer
Q1 = 8, Q2 = 16 and Q3 = 27, ⇒Q3 − Q2 = 11 > Q2 − Q1 = 8 ⇒positive skew.
Question 2
A sample of the weights of apples picked from one tree had mean 103 g, median 105 g and mode 106 g. Describe the skewness of the sample. Give a reason for your answer.
Answer
Mean = 103 < median = 105 < mode = 106 ⇒negative skew.
二项分布与泊松分布Binomial and Poisson distributions
Question 1
A company claims that a quarter of the bolts sent to them are faulty. To test this claim the number of faulty bolts in a random sample of 50 is recorded. Give two reasons why a binomial distribution may be a suitable model for the number of faulty bolts in the sample
Answer
| Two from | There are exactly 2 outcomes, faulty bolts or not faulty. The probability of a faulty bolt is constant Choices of bolts are independent. There is a fixed number of trials, 50 bolts selected. |
Question 2
State two conditions under which a Poisson distribution is a suitable model for the number of misprints on a page.
Answer
Misprints occur randomly / independently, singly and at a constant rateany two of the 3
Question 3
An estate agent sells houses at a mean rate of 7 per week.
Suggest a suitable model to represent the number of properties sold in a randomly chosen week. Give two reasons to support your model.
Answer
Poisson, Po(7). Sales of houses occur independently/randomly, singly, at a constant rate.
Question 4
A call centre agent handles telephone calls at a rate of 18 per hour.
(a) Give two reasons to support the use of a Poisson distribution as a suitable model for the number of calls per hour handled by the agent.
Answer
Calls occur singlyany two of the 3
Calls occur at a constant rate
Calls occur independently or randomly.
Question 5
The number of daisies in each of several equal size squares was counted. The mean number of daisies per square was 36⋅9 and the variance was 37⋅3. Explain why these figures support the choice of a Poisson distribution as a model.
Answer
For a Poisson model, Mean = Variance ; for these data 36⋅9 ≈37⋅3 ⇒ Poisson
对泊松与二项的近似Approximations to Poisson and Binomial
Question 1
Over a long period it is known that 2% of articles produced are defective. A sample of 200 articles is taken. What distribution describes this situation, and what is a suitable approximation to estimate the probability that there are exactly 5 defective articles.
Answer
Binomial distribution X ~ B(200 , 0⋅02) describes this situation.
n = 200 is large, p = 0⋅02 is small so use the Poisson approximation Y ~ Po (np) ⇔ Po (4).
Question 2
| (a) | State the condition under which the normal distribution may be used as an approximation to the Poisson distribution. |
| (b) | Explain why a continuity correction must be incorporated when using the normal distribution as an approximation to the Poisson distribution. |
Answer
| (a) | λ > 10 or large (use of µ instead of λ is OK). |
| (b) | The Poisson distribution is discrete and the normal distribution is continuous. |
Question 3
Write down the conditions under which the Poisson distribution may be used as an approximation to the Binomial distribution.
Answer
If X ~ B(n,p) and
n is large, n > about 50
p is small, p < 0⋅2, or q = 1 – p is small
but I would not worry too much about the 0⋅2 and the 50.
then X can be approximated by Po(np), or Po(nq)
Question 4
Write down two conditions for X ~ B (n, p) to be approximated by a normal distribution
Y ~ N (µ, σ2).
Answer
If X ~ B(n,p) and
| n is large or n > 10 | or np > 5 or nq >5 |
| p is close to 0.5 | or nq > 5 and np> 5 |
then X ~ B(n,p) can be approximated by Y ~ N(np, npq).
抽样Sampling
Question 1
Explain what you understand by
| (a) | a sampling unit. |
| (b) | a sampling frame. |
| (c) | a sampling distribution. |
Answer
| (a) | Individual member or element of the population or sampling frame. |
| (b) | A list by name or number of all sampling units or all the population. |
| (c) | All possible samples are chosen from a population; the values of a statistic together with the associated probabilities is a sampling distribution. |
Question 2
Before introducing a new rule, the secretary of a golf club decided to find out how members might react to this rule.
| (a) | Explain why the secretary decided to take a random sample of club members rather than ask all the members. |
| (b) | Suggest a suitable sampling frame. |
| (c) | Identify the sampling units. |
Answer
| (a) | Saves time / cheaper / easier or a census/asking all members takes a long time or is expensive or difficult to carry out |
| (b) | List, register or database of all club members/golfers |
| (c) | Club member(s) |
Question 3
A bag has a large number of discs numbered 1, 2 or 3. One third of the discs have the number 1, half of the discs have the number 2 and one sixth of the discs have the number 3. Samples of size 3 are taken from the bag. What is meant by the sampling distribution of the median, M.?
Answer
Find all possible samples, with their probabilities, of three discs and calculate their medians. Then give all possible values of the median, 1 or 2 or 3, together with their probabilities.
Question 4
11% of pupils in a large school are left handed. Samples of size 20 pupils are taken. Describe the sampling distribution of the number of left handed pupils.
Answer
To find the sampling distribution of the number of left handed pupils, we take all possible values of the number of left handed pupils, 0, 1, 2, 3, …, 20 in a sample, and calculate their probabilities.
This is the binomial distribution, P(X) = r = 20Cr(1 − 0⋅11)20 − r × 0⋅11r, which can be summarised as B(20, 0⋅11)
So the sampling distribution of the number of left handed people is B(20, 0⋅11).
9附录Appendix
二项分布的均值与方差Mean and variance of B(n, p)
公式证明Proof of formulae
对于单次试验,设成功概率为 p、失败概率为 q,且 p + q = 1:
| 成功次数number of success | 概率probability | ||
| y | p | yp | y2p |
| 0 | q | 0 | 0 |
| 1 | p | p | p |
对 n 次独立单次试验,X1, X2, X3, …, Xn,
于是对 X ∼ B(n, p),有
注意:结论 I 要求所有 Xi 相互独立 – 见 S3。
连续均匀分布Mean and variance for a continuous uniform distribution
公式证明Proof of formulae
(a) 期望
或由对称性得。
(b) 方差
二项分布的正态近似Normal approximation to the Binomial
X ∼ B(n, p) 如上图所示。
x 的相邻取值为 i, i + 1 ⇒ δx = 1。
设 y 的对应值为 yi 与 yi+1。
所以 y 相邻取值之差为 δy = yi+1 − yi
我们令 n 无限增大,因此作变量替换,使图象仍留在页面之内。
为保持面积为 1,令 Yi = yi√npq
令 δX → 0
因为二项分布直方图下的面积为 1,所以曲线下的面积也是 1(变量替换保证了面积不变):
我们可以证明(见下页):
e−0.5x2 的积分Integral of e^(-0.5x2)
曲面
这个曲面可以看作把曲线 y = e−0.5x2 绕 z 轴旋转 2π 得到。
为求体积,在 xy 平面取一个小区域,或在 rθ 平面取一个面积元,乘上 z 得到一根竖直「柱」的体积,再作二重求和得总体积。
在 xy 平面
矩形面积为 δx × δy
⇒ 柱的体积为 z δx δy
⇒ 总体积为 ∑∑ z δx δy
在 rθ 平面
面积元约为 r δθ δr
⇒ 柱的体积为 z r δθ δr
⇒ 总体积为 ∑∑ z r δθ δr
泊松概率的第一原理推导Poisson probabilities from first principles
预备结果Preliminary result
在泊松分布中,事件必须均匀(或以恒定速率)、逐个、随机且独立地发生。
设泊松分布的参数 µ 为长度 1 的区间内平均发生次数,则长度为 t 的区间内平均发生次数为 µ t。
把长度为 t 的区间等分为 n 个很小的区间,每个长度为 δt,于是 t = n δt。
由于事件逐个发生,在长度为 δt 的区间内发生 1 个事件的概率很小,而发生 2 个事件的概率可忽略。
可以这样近似:在 δt 内发生 1 个事件的概率为 p,多于 1 个事件的概率为 0。因此 δt 内发生 0 个事件的概率为 1 − p。
现在我们有二项分布 B(n, p),它给出在 t = n δt 的区间内发生 i 个事件(近似)的概率,其中 i = 0, 1, 2, …, n。
长度为 t 的区间内平均次数,按 B(n, p) 算是 np,按泊松分布算是 µ t。
以下我们取
我们忽略在 δt 内发生多于 1 个事件的可能性。
推导泊松概率Deriving the Poisson probabilities
令 pi(t) = 长度为 t 的区间内发生 i 个事件的概率。
则
且
当 δt → 0,dp0dt = −µ p0
🎓 成绩等级与 A* 规则
单元成绩由原始分(Raw)换算为统一分(UMS)后合并计算。各等级所需的最低 UMS 分如下:
| 资格等级 | 最高 UMS 分 | A | B | C | D | E |
|---|---|---|---|---|---|---|
| International AS(合并代码 XMA01、XFM01、XPM01) | 300 | 240 | 210 | 180 | 150 | 120 |
| International A Level(合并代码 YMA01、YFM01、YPM01) | 600 | 480 | 420 | 360 | 300 | 240 |
总 UMS 在 0–119(International AS)或 0–239(International A Level)区间的考生将被评为 Unclassified(U,未分级)。
- IAL 数学(Mathematics):总分达 A(至少 480 / 600),且 P3、P4 两单元合计 UMS 至少 180 / 200,方授予 A*。
- IAL 进阶数学(Further Mathematics):总分达 A(至少 480 / 600),且成绩最好的三个 IA2 单元(纯数或应用单元均可)合计 UMS 至少 270 / 300,方授予 A*。
- IAL 纯数学(Pure Mathematics):总分达 A(至少 480 / 600),且 IA2 单元合计 UMS 至少 270 / 300,方授予 A*。
译自 Pearson Edexcel《International Advanced Level Mathematics / Further Mathematics / Pure Mathematics Specification》(Issue 3, 2019)第 74 页「Qualification results」。
📈 近三次考季分数线(官方文件截图)
每次考季后 Pearson 按当次试卷难度公布各单元的 Raw(原始分)分界;UMS 分界固定不变(AS 单元 a–e 对应 80/70/60/50/40,A2 单元另设 a* = 90)。表中同一单元的两行(如 Unit 1 与 Unit 1A)为同一份试卷的不同版本,Raw 分界不同、UMS 分界相同,具体以考生所考版本为准。
📍 2026年6月考季
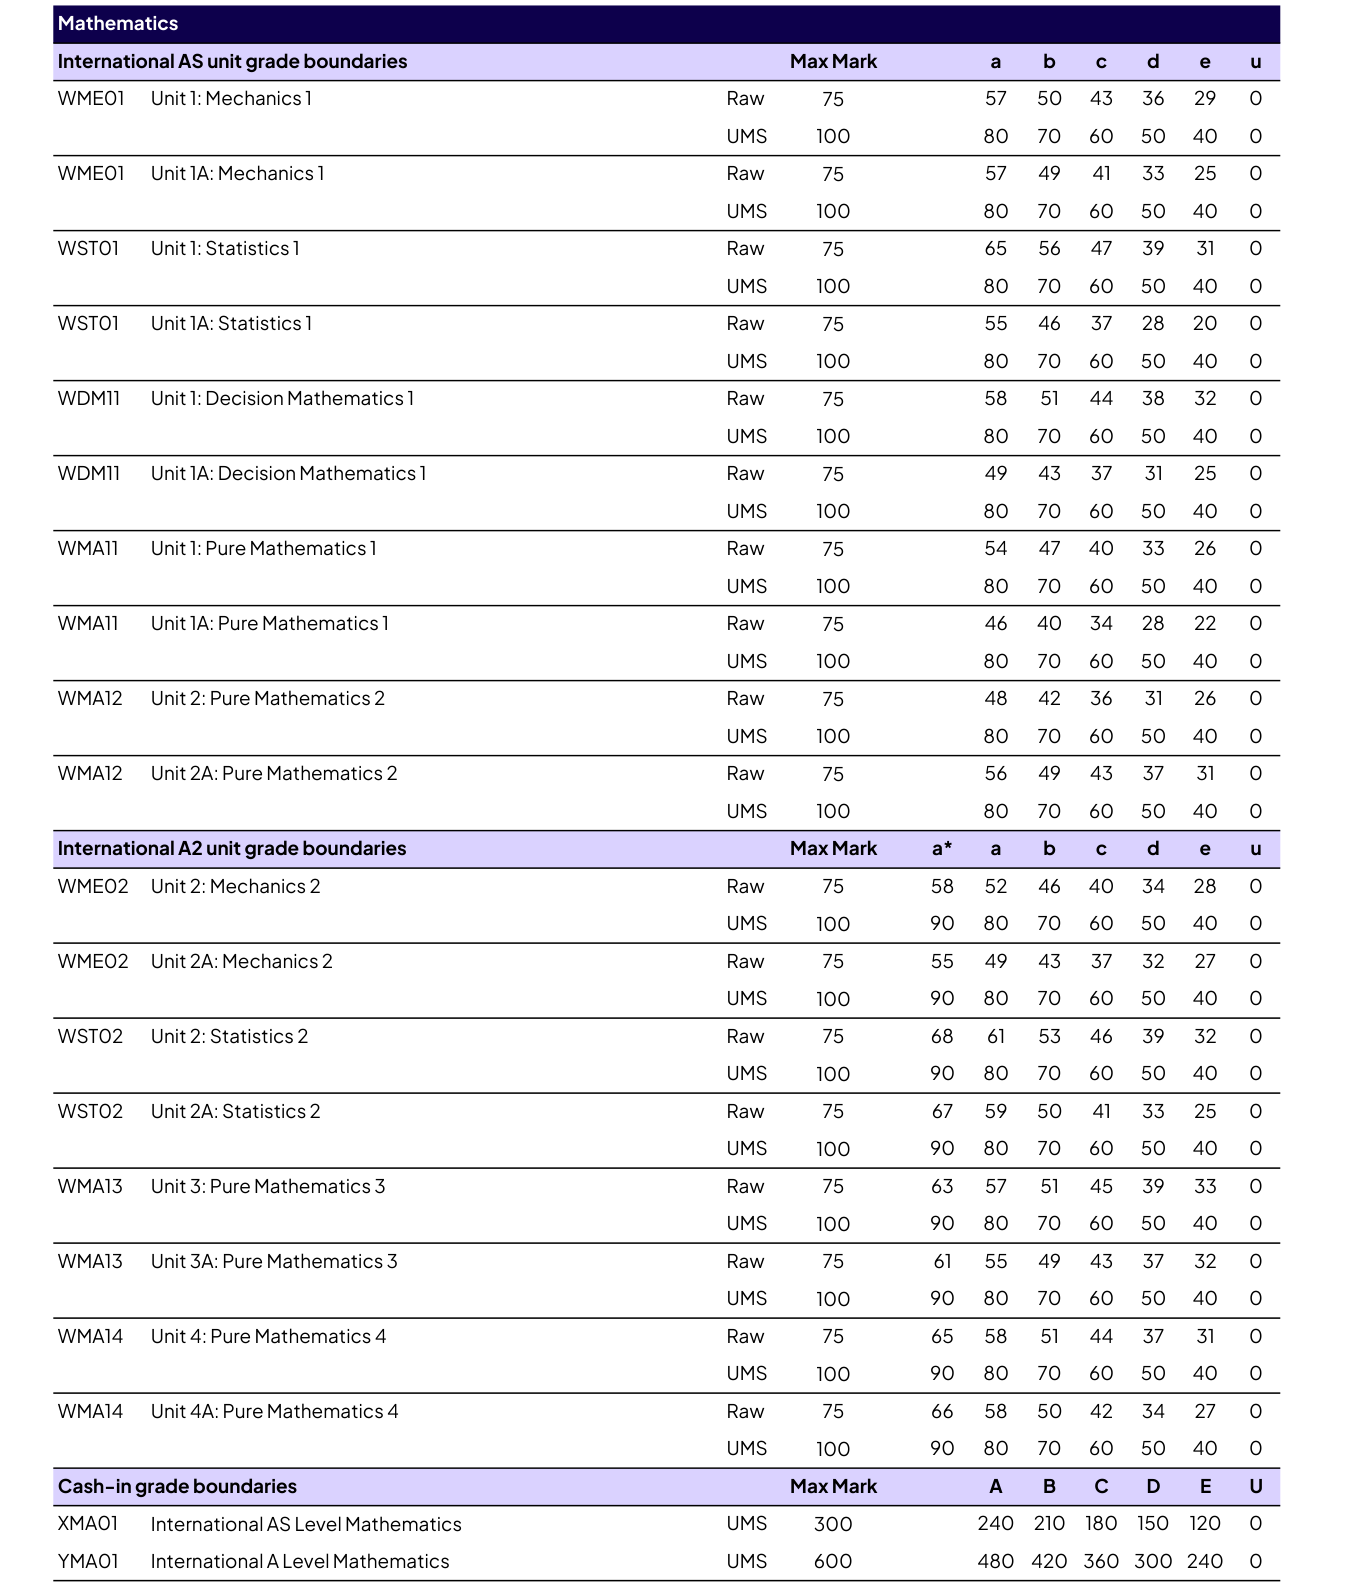
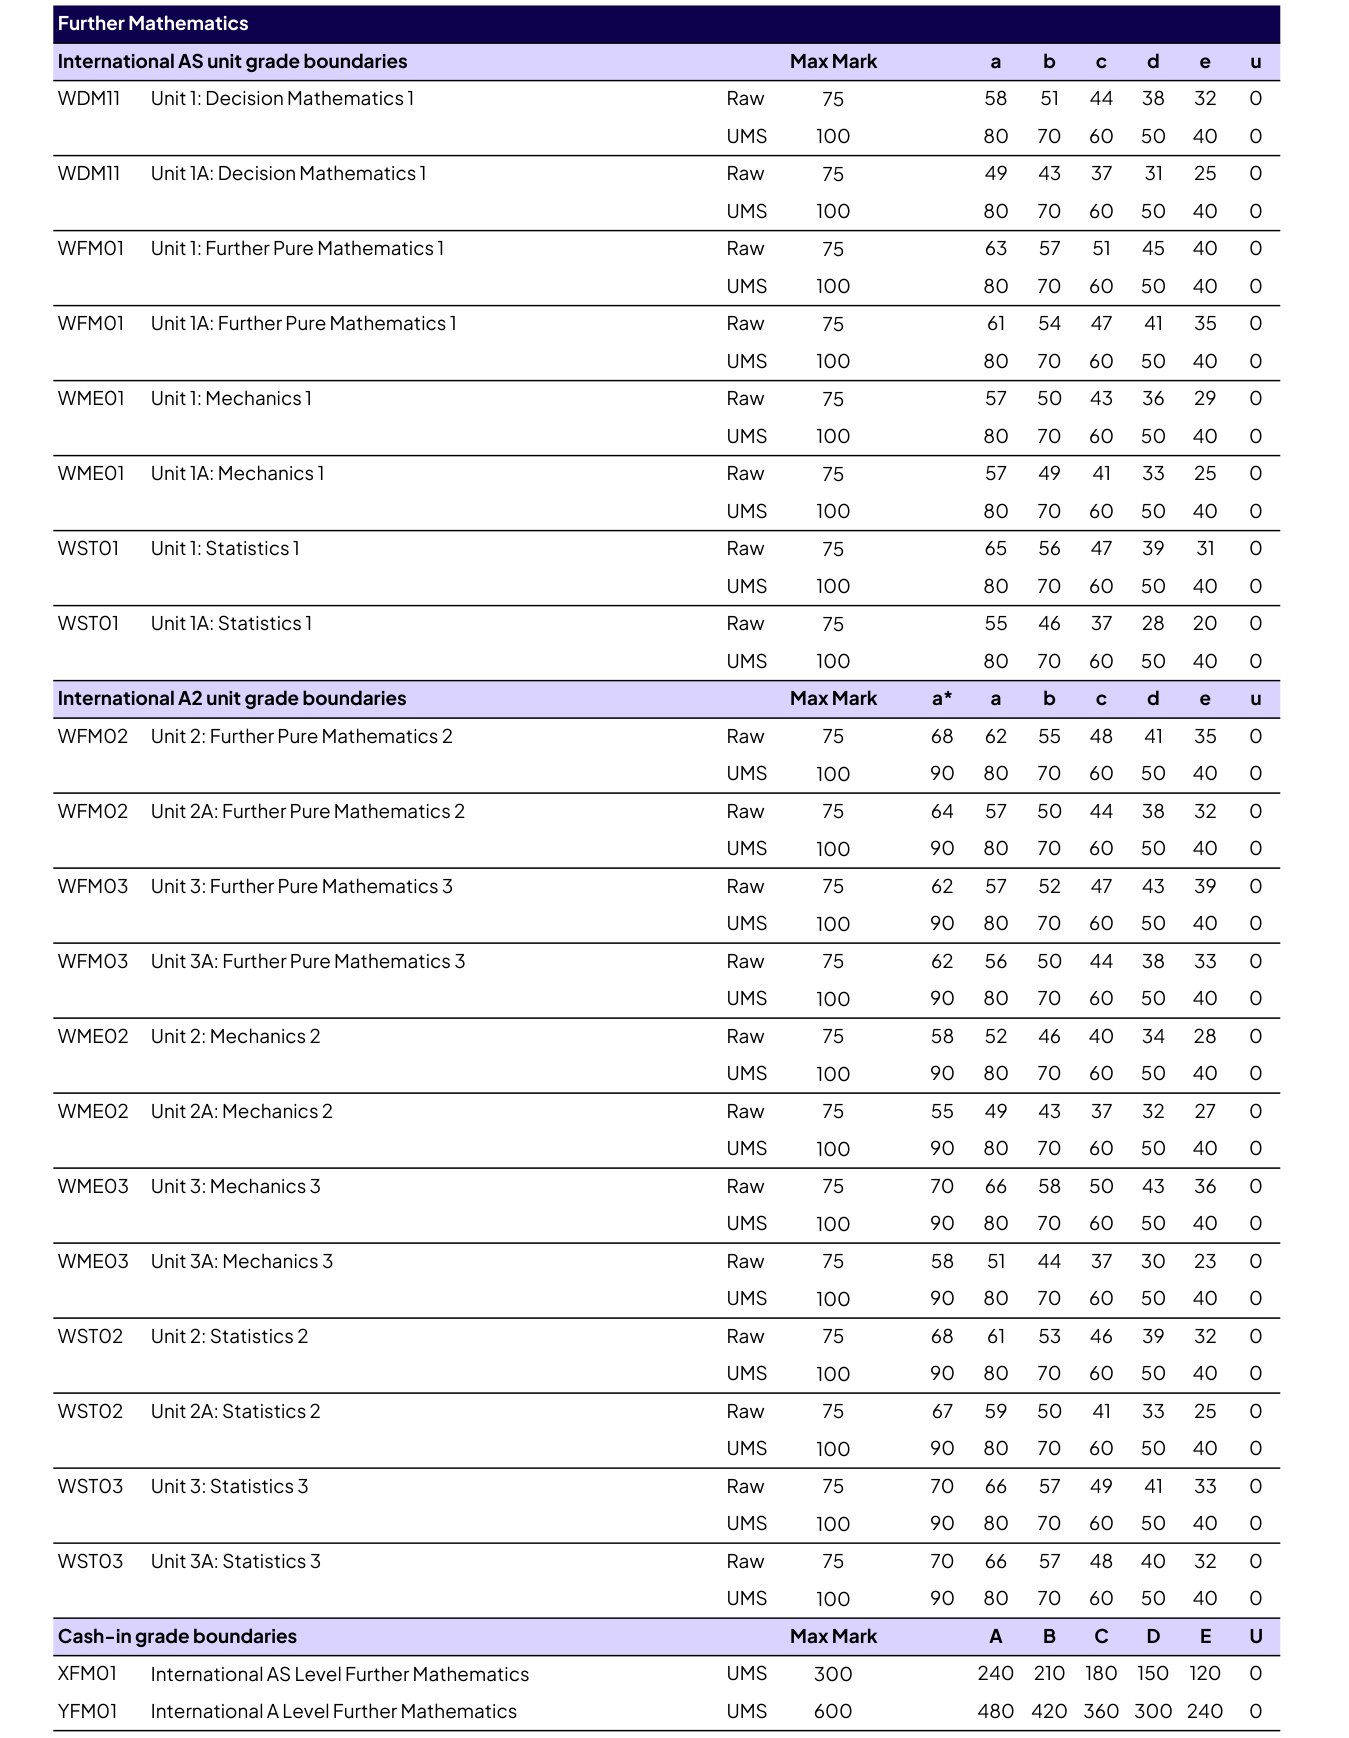
📍 2026年1月考季
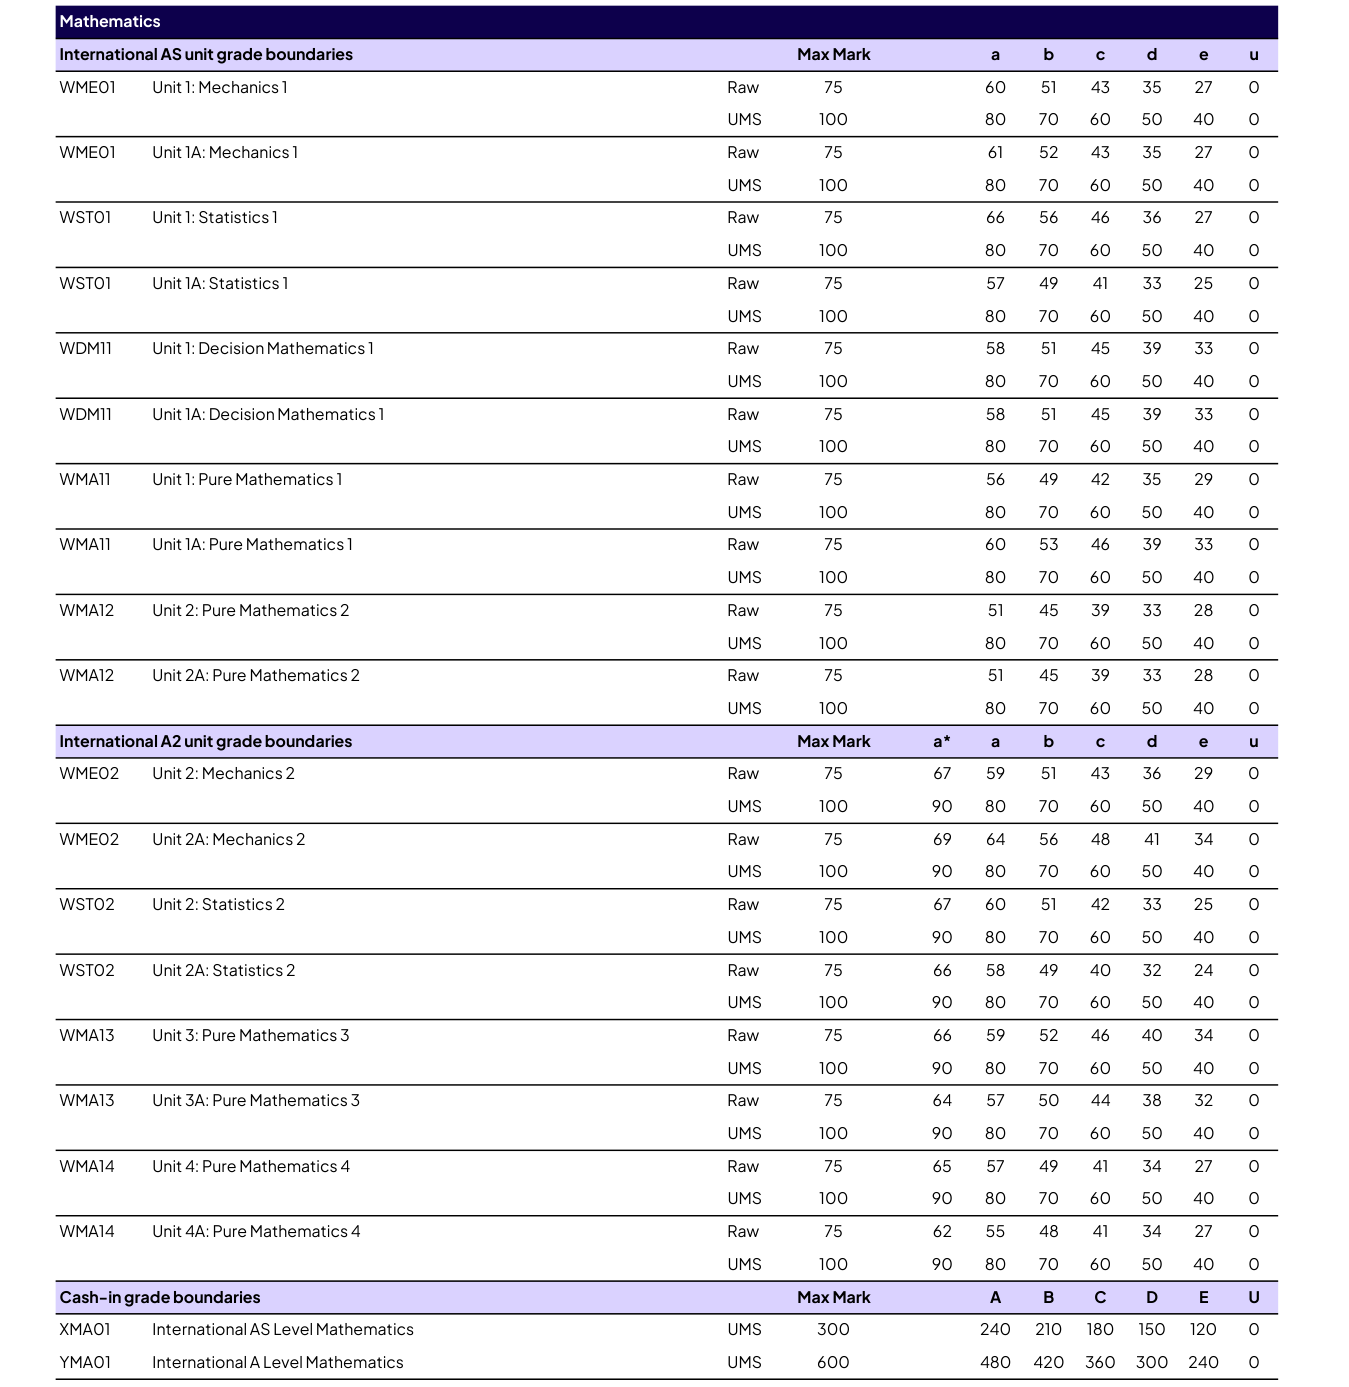
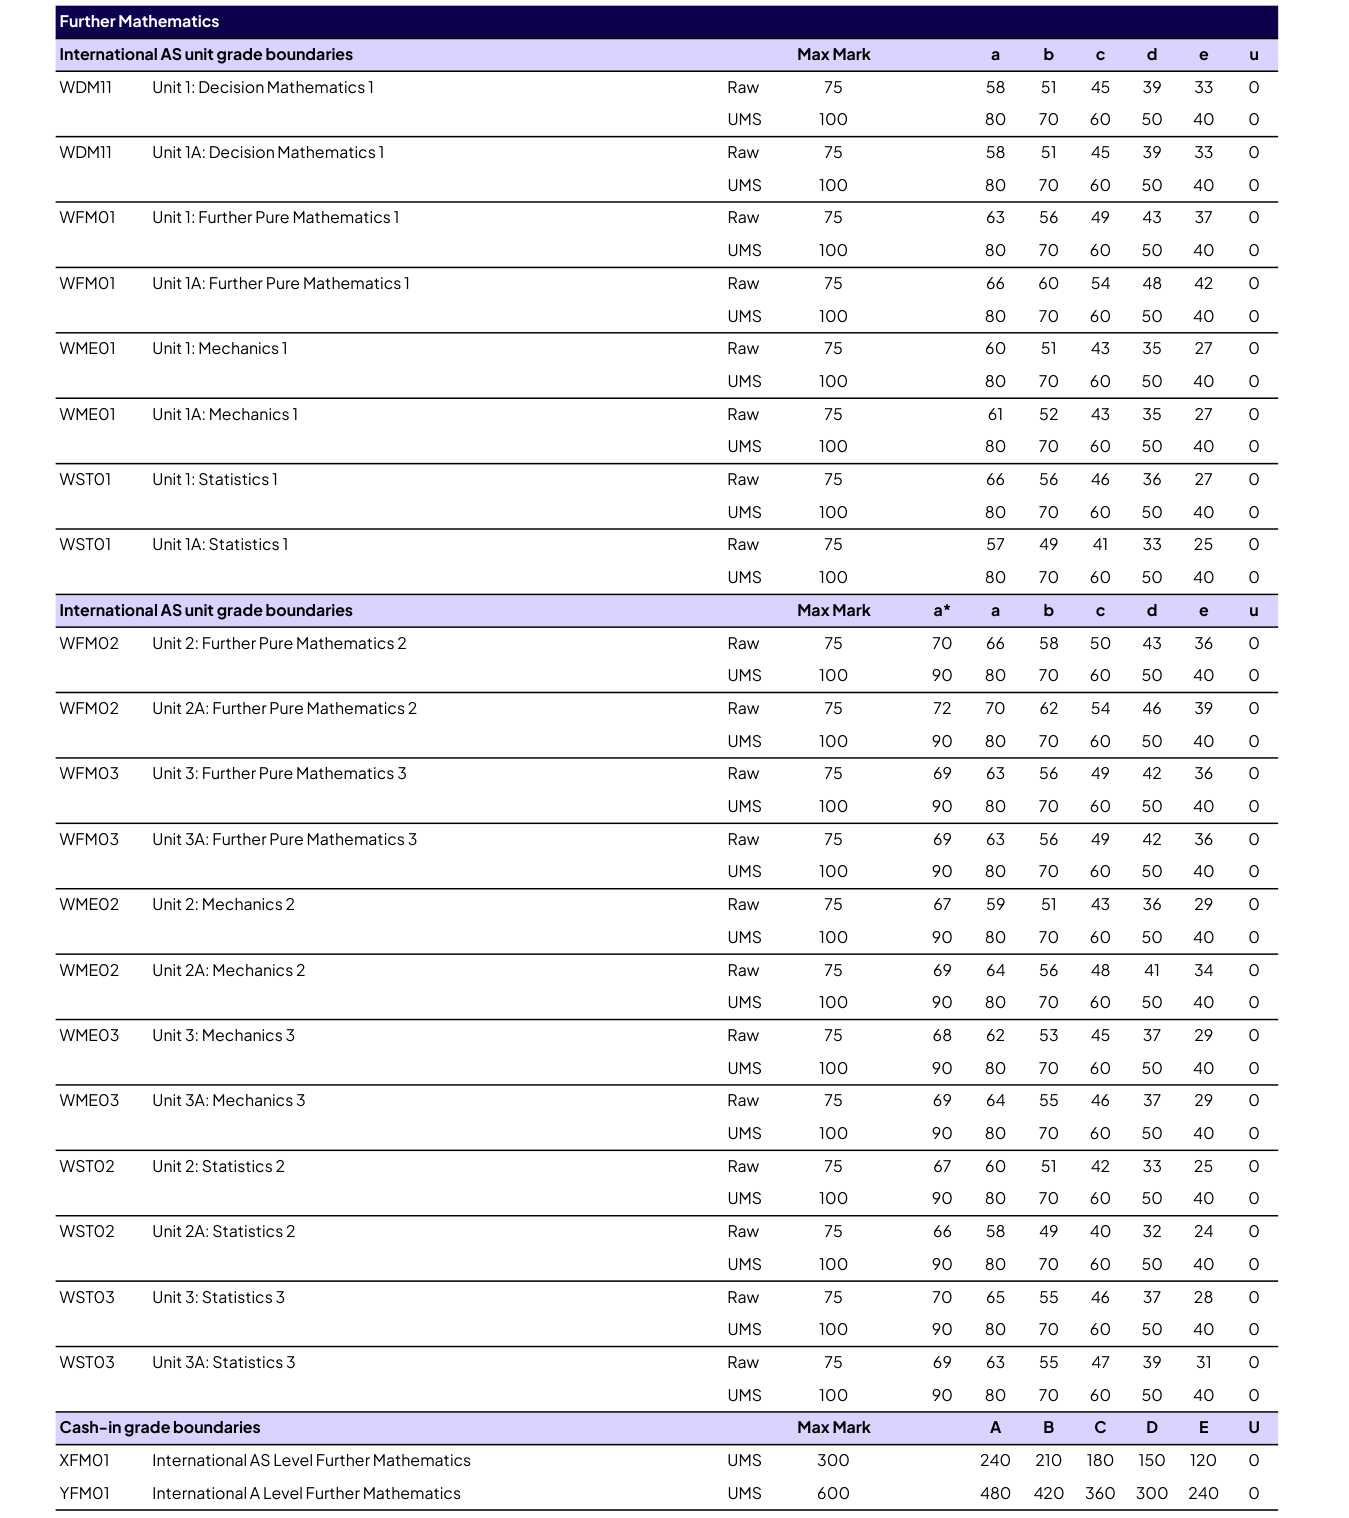
📍 2025年10月考季
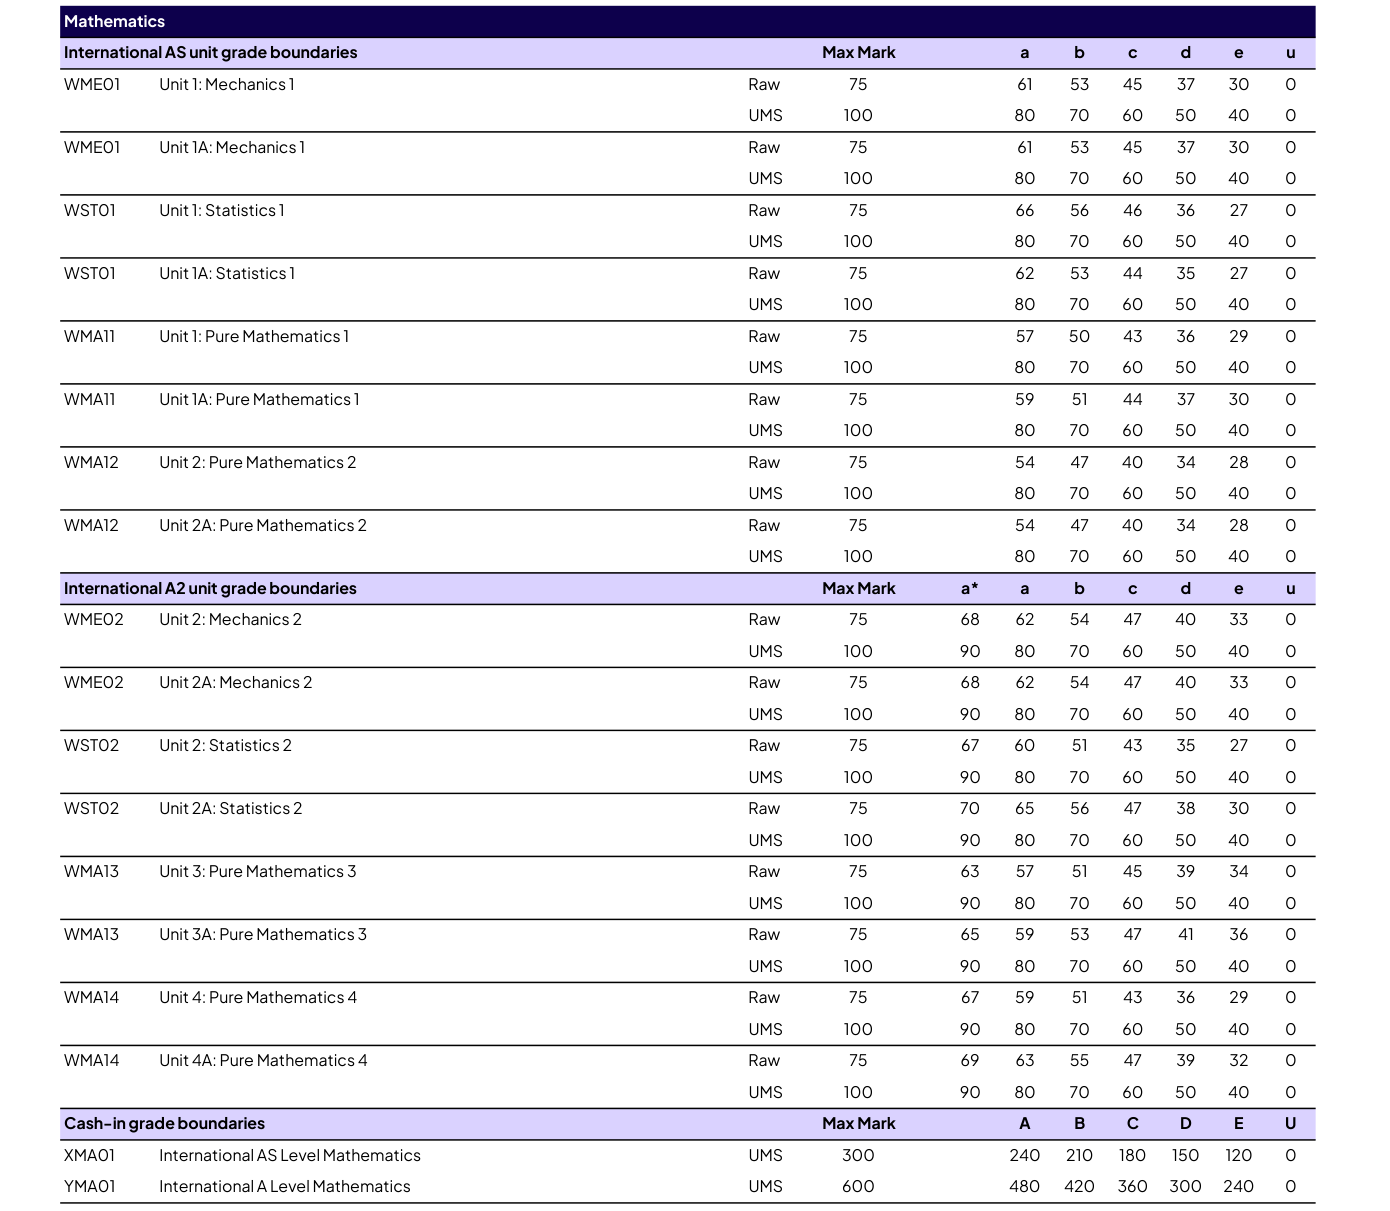
截图来源:qualifications.pearson.com 官方「Grade boundaries — International A Level」文件(2026 年 6 月 / 2026 年 1 月 / 2025 年 10 月考季)。2025 年 10 月考季官方文件未含进阶数学段落(该考季未开放相应单元)。
📝 S2 分类真题 Categorised Past Papers
Edexcel IAL WST02 (S2) 2019–2026 共 23 卷 / 156 题(含 01a 区域变体), 按站点 7 个章节、34 个知识点双语分类。点开任一知识点即可看到对应年份的真题; 每题附「题目 Question」与「详解 Mark Scheme」两个链接,均为所在完整试卷页原版(PDF 整页,不裁剪)。
同一知识点可能出现在多个章节之下(各章只列属于该章的题)。
1 · 二项分布 Binomial Distribution (15 题)
二项概率计算 Binomial probabilities (14 题)
| 试卷 Session | 题号 | 分值 | 链接 Links |
|---|---|---|---|
| 2019 Jan | Q1 | 7 | 题目 Question · 详解 Mark Scheme |
| 2019 Jun | Q6 | 11 | 题目 Question · 详解 Mark Scheme |
| 2019 Oct | Q1 | 9 | 题目 Question · 详解 Mark Scheme |
| 2020 Jan | Q2 | 15 | 题目 Question · 详解 Mark Scheme |
| 2022 Jun | Q1 | 10 | 题目 Question · 详解 Mark Scheme |
| 2023 Oct | Q1 | 10 | 题目 Question · 详解 Mark Scheme |
| 2024 Oct | Q2 | 12 | 题目 Question · 详解 Mark Scheme |
| 2025 Jun | Q3 | 10 | 题目 Question · 详解 Mark Scheme |
| 2025 Oct | Q5 | 15 | 题目 Question · 详解 Mark Scheme |
| 2026 Jan | Q1 | 7 | 题目 Question · 详解 Mark Scheme |
| 2026 Jan 01A | Q1 | 9 | 题目 Question · 详解 Mark Scheme |
| 2026 Jan 01A | Q2 | 10 | 题目 Question · 详解 Mark Scheme |
| 2026 Jun | Q5 | 16 | 题目 Question · 详解 Mark Scheme |
| 2026 Jun 01A | Q7 | 10 | 题目 Question · 详解 Mark Scheme |
累积概率 Cumulative probabilities (9 题)
| 试卷 Session | 题号 | 分值 | 链接 Links |
|---|---|---|---|
| 2019 Jun | Q6 | 11 | 题目 Question · 详解 Mark Scheme |
| 2020 Jan | Q2 | 15 | 题目 Question · 详解 Mark Scheme |
| 2022 Jun | Q1 | 10 | 题目 Question · 详解 Mark Scheme |
| 2023 Oct | Q1 | 10 | 题目 Question · 详解 Mark Scheme |
| 2024 Oct | Q2 | 12 | 题目 Question · 详解 Mark Scheme |
| 2025 Jun | Q7 | 14 | 题目 Question · 详解 Mark Scheme |
| 2025 Oct | Q5 | 15 | 题目 Question · 详解 Mark Scheme |
| 2026 Jan 01A | Q1 | 9 | 题目 Question · 详解 Mark Scheme |
| 2026 Jun | Q5 | 16 | 题目 Question · 详解 Mark Scheme |
二项期望与方差 Mean and variance of B(n,p) (10 题)
| 试卷 Session | 题号 | 分值 | 链接 Links |
|---|---|---|---|
| 2019 Jan | Q1 | 7 | 题目 Question · 详解 Mark Scheme |
| 2019 Jun | Q6 | 11 | 题目 Question · 详解 Mark Scheme |
| 2019 Oct | Q1 | 9 | 题目 Question · 详解 Mark Scheme |
| 2020 Jan | Q2 | 15 | 题目 Question · 详解 Mark Scheme |
| 2023 Oct | Q1 | 10 | 题目 Question · 详解 Mark Scheme |
| 2024 Oct | Q2 | 12 | 题目 Question · 详解 Mark Scheme |
| 2025 Jun | Q3 | 10 | 题目 Question · 详解 Mark Scheme |
| 2026 Jan 01A | Q2 | 10 | 题目 Question · 详解 Mark Scheme |
| 2026 Jun | Q5 | 16 | 题目 Question · 详解 Mark Scheme |
| 2026 Jun 01A | Q7 | 10 | 题目 Question · 详解 Mark Scheme |
二项建模 Modelling with the binomial (5 题)
| 试卷 Session | 题号 | 分值 | 链接 Links |
|---|---|---|---|
| 2019 Jan | Q1 | 7 | 题目 Question · 详解 Mark Scheme |
| 2019 Jun | Q6 | 11 | 题目 Question · 详解 Mark Scheme |
| 2024 Oct | Q2 | 12 | 题目 Question · 详解 Mark Scheme |
| 2025 Jun | Q7 | 14 | 题目 Question · 详解 Mark Scheme |
| 2026 Jan | Q1 | 7 | 题目 Question · 详解 Mark Scheme |
二项众数 Mode of the binomial (1 题)
| 试卷 Session | 题号 | 分值 | 链接 Links |
|---|---|---|---|
| 2022 Jun | Q1 | 10 | 题目 Question · 详解 Mark Scheme |
泊松概率计算 Poisson probabilities (3 题)
| 试卷 Session | 题号 | 分值 | 链接 Links |
|---|---|---|---|
| 2022 Jun | Q1 | 10 | 题目 Question · 详解 Mark Scheme |
| 2026 Jan 01A | Q2 | 10 | 题目 Question · 详解 Mark Scheme |
| 2026 Jun 01A | Q7 | 10 | 题目 Question · 详解 Mark Scheme |
泊松近似二项 Poisson approximation to the binomial (2 题)
| 试卷 Session | 题号 | 分值 | 链接 Links |
|---|---|---|---|
| 2025 Jun | Q3 | 10 | 题目 Question · 详解 Mark Scheme |
| 2026 Jan 01A | Q1 | 9 | 题目 Question · 详解 Mark Scheme |
泊松期望与方差 Mean and variance of Poisson (1 题)
| 试卷 Session | 题号 | 分值 | 链接 Links |
|---|---|---|---|
| 2022 Jun | Q1 | 10 | 题目 Question · 详解 Mark Scheme |
E(g(X))与V(g(X)) E(g(X)) and V(g(X)) (1 题)
| 试卷 Session | 题号 | 分值 | 链接 Links |
|---|---|---|---|
| 2024 Oct | Q2 | 12 | 题目 Question · 详解 Mark Scheme |
二项的正态近似 Normal approximation to the binomial (4 题)
| 试卷 Session | 题号 | 分值 | 链接 Links |
|---|---|---|---|
| 2025 Jun | Q7 | 14 | 题目 Question · 详解 Mark Scheme |
| 2025 Oct | Q5 | 15 | 题目 Question · 详解 Mark Scheme |
| 2026 Jan 01A | Q2 | 10 | 题目 Question · 详解 Mark Scheme |
| 2026 Jun 01A | Q7 | 10 | 题目 Question · 详解 Mark Scheme |
连续性修正 Continuity correction (2 题)
| 试卷 Session | 题号 | 分值 | 链接 Links |
|---|---|---|---|
| 2025 Jun | Q7 | 14 | 题目 Question · 详解 Mark Scheme |
| 2025 Oct | Q5 | 15 | 题目 Question · 详解 Mark Scheme |
总体与样本 Populations and samples (1 题)
| 试卷 Session | 题号 | 分值 | 链接 Links |
|---|---|---|---|
| 2026 Jan | Q1 | 7 | 题目 Question · 详解 Mark Scheme |
抽样方法 Sampling methods (1 题)
| 试卷 Session | 题号 | 分值 | 链接 Links |
|---|---|---|---|
| 2026 Jan | Q1 | 7 | 题目 Question · 详解 Mark Scheme |
二项假设检验 Hypothesis test for p (5 题)
| 试卷 Session | 题号 | 分值 | 链接 Links |
|---|---|---|---|
| 2019 Jun | Q6 | 11 | 题目 Question · 详解 Mark Scheme |
| 2020 Jan | Q2 | 15 | 题目 Question · 详解 Mark Scheme |
| 2025 Jun | Q7 | 14 | 题目 Question · 详解 Mark Scheme |
| 2025 Oct | Q5 | 15 | 题目 Question · 详解 Mark Scheme |
| 2026 Jun | Q5 | 16 | 题目 Question · 详解 Mark Scheme |
显著性水平与临界域 Significance levels and critical regions (2 题)
| 试卷 Session | 题号 | 分值 | 链接 Links |
|---|---|---|---|
| 2019 Jun | Q6 | 11 | 题目 Question · 详解 Mark Scheme |
| 2020 Jan | Q2 | 15 | 题目 Question · 详解 Mark Scheme |
正态分布反求参数 Finding normal parameters (1 题)
| 试卷 Session | 题号 | 分值 | 链接 Links |
|---|---|---|---|
| 2026 Jan 01A | Q1 | 9 | 题目 Question · 详解 Mark Scheme |
2 · 泊松分布 Poisson Distribution (22 题)
泊松概率计算 Poisson probabilities (21 题)
| 试卷 Session | 题号 | 分值 | 链接 Links |
|---|---|---|---|
| 2019 Jan | Q2 | 12 | 题目 Question · 详解 Mark Scheme |
| 2019 Jun | Q1 | 15 | 题目 Question · 详解 Mark Scheme |
| 2020 Jan | Q1 | 14 | 题目 Question · 详解 Mark Scheme |
| 2020 Oct | Q4 | 16 | 题目 Question · 详解 Mark Scheme |
| 2021 Jun | Q2 | 15 | 题目 Question · 详解 Mark Scheme |
| 2022 Jan | Q1 | 11 | 题目 Question · 详解 Mark Scheme |
| 2022 Jun | Q5 | 10 | 题目 Question · 详解 Mark Scheme |
| 2022 Oct | Q1 | 11 | 题目 Question · 详解 Mark Scheme |
| 2023 Jan | Q1 | 11 | 题目 Question · 详解 Mark Scheme |
| 2023 Jun | Q7 | 12 | 题目 Question · 详解 Mark Scheme |
| 2024 Jan | Q1 | 16 | 题目 Question · 详解 Mark Scheme |
| 2024 Jun | Q1 | 13 | 题目 Question · 详解 Mark Scheme |
| 2024 Jun | Q5 | 12 | 题目 Question · 详解 Mark Scheme |
| 2024 Oct | Q1 | 8 | 题目 Question · 详解 Mark Scheme |
| 2025 Jan | Q1 | 11 | 题目 Question · 详解 Mark Scheme |
| 2025 Oct 01A | Q5 | 13 | 题目 Question · 详解 Mark Scheme |
| 2026 Jan 01A | Q7 | 12 | 题目 Question · 详解 Mark Scheme |
| 2026 Jun | Q3 | 14 | 题目 Question · 详解 Mark Scheme |
| 2026 Jun | Q6 | 8 | 题目 Question · 详解 Mark Scheme |
| 2026 Jun 01A | Q1 | 10 | 题目 Question · 详解 Mark Scheme |
| 2026 Jun 01A | Q3 | 9 | 题目 Question · 详解 Mark Scheme |
泊松合并率 Combining Poisson rates (4 题)
| 试卷 Session | 题号 | 分值 | 链接 Links |
|---|---|---|---|
| 2020 Jan | Q1 | 14 | 题目 Question · 详解 Mark Scheme |
| 2022 Jan | Q1 | 11 | 题目 Question · 详解 Mark Scheme |
| 2022 Jun | Q5 | 10 | 题目 Question · 详解 Mark Scheme |
| 2026 Jun 01A | Q1 | 10 | 题目 Question · 详解 Mark Scheme |
时间空间单位换算 Scaling over time/space intervals (14 题)
| 试卷 Session | 题号 | 分值 | 链接 Links |
|---|---|---|---|
| 2019 Jan | Q2 | 12 | 题目 Question · 详解 Mark Scheme |
| 2019 Jun | Q1 | 15 | 题目 Question · 详解 Mark Scheme |
| 2020 Oct | Q4 | 16 | 题目 Question · 详解 Mark Scheme |
| 2021 Jun | Q2 | 15 | 题目 Question · 详解 Mark Scheme |
| 2022 Jun | Q5 | 10 | 题目 Question · 详解 Mark Scheme |
| 2022 Oct | Q1 | 11 | 题目 Question · 详解 Mark Scheme |
| 2023 Jun | Q7 | 12 | 题目 Question · 详解 Mark Scheme |
| 2024 Jun | Q1 | 13 | 题目 Question · 详解 Mark Scheme |
| 2024 Jun | Q5 | 12 | 题目 Question · 详解 Mark Scheme |
| 2024 Oct | Q1 | 8 | 题目 Question · 详解 Mark Scheme |
| 2025 Oct 01A | Q5 | 13 | 题目 Question · 详解 Mark Scheme |
| 2026 Jan 01A | Q7 | 12 | 题目 Question · 详解 Mark Scheme |
| 2026 Jun | Q3 | 14 | 题目 Question · 详解 Mark Scheme |
| 2026 Jun 01A | Q1 | 10 | 题目 Question · 详解 Mark Scheme |
泊松近似二项 Poisson approximation to the binomial (7 题)
| 试卷 Session | 题号 | 分值 | 链接 Links |
|---|---|---|---|
| 2020 Jan | Q1 | 14 | 题目 Question · 详解 Mark Scheme |
| 2020 Oct | Q4 | 16 | 题目 Question · 详解 Mark Scheme |
| 2024 Jan | Q2 | 8 | 题目 Question · 详解 Mark Scheme |
| 2024 Jun | Q5 | 12 | 题目 Question · 详解 Mark Scheme |
| 2025 Jan | Q1 | 11 | 题目 Question · 详解 Mark Scheme |
| 2026 Jun | Q6 | 8 | 题目 Question · 详解 Mark Scheme |
| 2026 Jun 01A | Q3 | 9 | 题目 Question · 详解 Mark Scheme |
泊松期望与方差 Mean and variance of Poisson (4 题)
| 试卷 Session | 题号 | 分值 | 链接 Links |
|---|---|---|---|
| 2019 Jun | Q1 | 15 | 题目 Question · 详解 Mark Scheme |
| 2021 Jun | Q2 | 15 | 题目 Question · 详解 Mark Scheme |
| 2024 Jan | Q1 | 16 | 题目 Question · 详解 Mark Scheme |
| 2026 Jan 01A | Q7 | 12 | 题目 Question · 详解 Mark Scheme |
泊松众数 Mode of the Poisson (1 题)
| 试卷 Session | 题号 | 分值 | 链接 Links |
|---|---|---|---|
| 2019 Jan | Q2 | 12 | 题目 Question · 详解 Mark Scheme |
泊松建模 Modelling with the Poisson (7 题)
| 试卷 Session | 题号 | 分值 | 链接 Links |
|---|---|---|---|
| 2019 Jun | Q1 | 15 | 题目 Question · 详解 Mark Scheme |
| 2020 Oct | Q4 | 16 | 题目 Question · 详解 Mark Scheme |
| 2022 Jun | Q5 | 10 | 题目 Question · 详解 Mark Scheme |
| 2023 Jan | Q1 | 11 | 题目 Question · 详解 Mark Scheme |
| 2024 Jan | Q1 | 16 | 题目 Question · 详解 Mark Scheme |
| 2024 Jun | Q1 | 13 | 题目 Question · 详解 Mark Scheme |
| 2026 Jun | Q3 | 14 | 题目 Question · 详解 Mark Scheme |
二项概率计算 Binomial probabilities (9 题)
| 试卷 Session | 题号 | 分值 | 链接 Links |
|---|---|---|---|
| 2022 Jan | Q1 | 11 | 题目 Question · 详解 Mark Scheme |
| 2022 Oct | Q1 | 11 | 题目 Question · 详解 Mark Scheme |
| 2023 Jun | Q7 | 12 | 题目 Question · 详解 Mark Scheme |
| 2024 Jan | Q1 | 16 | 题目 Question · 详解 Mark Scheme |
| 2024 Jan | Q2 | 8 | 题目 Question · 详解 Mark Scheme |
| 2024 Jun | Q1 | 13 | 题目 Question · 详解 Mark Scheme |
| 2024 Jun | Q5 | 12 | 题目 Question · 详解 Mark Scheme |
| 2025 Jan | Q1 | 11 | 题目 Question · 详解 Mark Scheme |
| 2026 Jun 01A | Q1 | 10 | 题目 Question · 详解 Mark Scheme |
累积概率 Cumulative probabilities (2 题)
| 试卷 Session | 题号 | 分值 | 链接 Links |
|---|---|---|---|
| 2020 Jan | Q1 | 14 | 题目 Question · 详解 Mark Scheme |
| 2022 Jan | Q1 | 11 | 题目 Question · 详解 Mark Scheme |
二项期望与方差 Mean and variance of B(n,p) (1 题)
| 试卷 Session | 题号 | 分值 | 链接 Links |
|---|---|---|---|
| 2026 Jun | Q6 | 8 | 题目 Question · 详解 Mark Scheme |
条件概率 Conditional probability (1 题)
| 试卷 Session | 题号 | 分值 | 链接 Links |
|---|---|---|---|
| 2023 Jun | Q7 | 12 | 题目 Question · 详解 Mark Scheme |
均匀分布概率 Uniform probabilities (1 题)
| 试卷 Session | 题号 | 分值 | 链接 Links |
|---|---|---|---|
| 2024 Jun | Q5 | 12 | 题目 Question · 详解 Mark Scheme |
泊松的正态近似 Normal approximation to the Poisson (9 题)
| 试卷 Session | 题号 | 分值 | 链接 Links |
|---|---|---|---|
| 2019 Jun | Q1 | 15 | 题目 Question · 详解 Mark Scheme |
| 2020 Jan | Q1 | 14 | 题目 Question · 详解 Mark Scheme |
| 2020 Oct | Q4 | 16 | 题目 Question · 详解 Mark Scheme |
| 2022 Jan | Q1 | 11 | 题目 Question · 详解 Mark Scheme |
| 2024 Jan | Q1 | 16 | 题目 Question · 详解 Mark Scheme |
| 2024 Oct | Q1 | 8 | 题目 Question · 详解 Mark Scheme |
| 2025 Oct 01A | Q5 | 13 | 题目 Question · 详解 Mark Scheme |
| 2026 Jun | Q3 | 14 | 题目 Question · 详解 Mark Scheme |
| 2026 Jun 01A | Q1 | 10 | 题目 Question · 详解 Mark Scheme |
连续性修正 Continuity correction (8 题)
| 试卷 Session | 题号 | 分值 | 链接 Links |
|---|---|---|---|
| 2020 Jan | Q1 | 14 | 题目 Question · 详解 Mark Scheme |
| 2020 Oct | Q4 | 16 | 题目 Question · 详解 Mark Scheme |
| 2022 Jan | Q1 | 11 | 题目 Question · 详解 Mark Scheme |
| 2024 Jan | Q1 | 16 | 题目 Question · 详解 Mark Scheme |
| 2024 Oct | Q1 | 8 | 题目 Question · 详解 Mark Scheme |
| 2025 Oct 01A | Q5 | 13 | 题目 Question · 详解 Mark Scheme |
| 2026 Jun | Q3 | 14 | 题目 Question · 详解 Mark Scheme |
| 2026 Jun 01A | Q1 | 10 | 题目 Question · 详解 Mark Scheme |
总体与样本 Populations and samples (1 题)
| 试卷 Session | 题号 | 分值 | 链接 Links |
|---|---|---|---|
| 2026 Jun 01A | Q3 | 9 | 题目 Question · 详解 Mark Scheme |
抽样方法 Sampling methods (1 题)
| 试卷 Session | 题号 | 分值 | 链接 Links |
|---|---|---|---|
| 2026 Jun 01A | Q3 | 9 | 题目 Question · 详解 Mark Scheme |
泊松假设检验 Hypothesis test for the Poisson mean (5 题)
| 试卷 Session | 题号 | 分值 | 链接 Links |
|---|---|---|---|
| 2020 Oct | Q4 | 16 | 题目 Question · 详解 Mark Scheme |
| 2021 Jun | Q2 | 15 | 题目 Question · 详解 Mark Scheme |
| 2023 Jan | Q1 | 11 | 题目 Question · 详解 Mark Scheme |
| 2024 Jun | Q1 | 13 | 题目 Question · 详解 Mark Scheme |
| 2026 Jun | Q3 | 14 | 题目 Question · 详解 Mark Scheme |
显著性水平与临界域 Significance levels and critical regions (1 题)
| 试卷 Session | 题号 | 分值 | 链接 Links |
|---|---|---|---|
| 2026 Jun | Q3 | 14 | 题目 Question · 详解 Mark Scheme |
3 · 连续随机变量 Continuous Random Variables (42 题)
概率密度函数 Probability density function (35 题)
累积分布函数 Cumulative distribution function (23 题)
| 试卷 Session | 题号 | 分值 | 链接 Links |
|---|---|---|---|
| 2019 Jan | Q3 | 8 | 题目 Question · 详解 Mark Scheme |
| 2019 Jan | Q7 | 14 | 题目 Question · 详解 Mark Scheme |
| 2019 Jun | Q7 | 9 | 题目 Question · 详解 Mark Scheme |
| 2019 Oct | Q4 | 14 | 题目 Question · 详解 Mark Scheme |
| 2020 Jan | Q4 | 15 | 题目 Question · 详解 Mark Scheme |
| 2020 Oct | Q5 | 13 | 题目 Question · 详解 Mark Scheme |
| 2022 Jan | Q2 | 8 | 题目 Question · 详解 Mark Scheme |
| 2022 Jan | Q4 | 15 | 题目 Question · 详解 Mark Scheme |
| 2022 Jun | Q6 | 13 | 题目 Question · 详解 Mark Scheme |
| 2022 Oct | Q5 | 9 | 题目 Question · 详解 Mark Scheme |
| 2023 Jan | Q6 | 18 | 题目 Question · 详解 Mark Scheme |
| 2023 Jun | Q5 | 14 | 题目 Question · 详解 Mark Scheme |
| 2023 Oct | Q6 | 12 | 题目 Question · 详解 Mark Scheme |
| 2024 Jan | Q7 | 8 | 题目 Question · 详解 Mark Scheme |
| 2024 Jun | Q2 | 9 | 题目 Question · 详解 Mark Scheme |
| 2024 Oct | Q5 | 9 | 题目 Question · 详解 Mark Scheme |
| 2025 Jun | Q1 | 11 | 题目 Question · 详解 Mark Scheme |
| 2025 Oct | Q4 | 9 | 题目 Question · 详解 Mark Scheme |
| 2025 Oct 01A | Q1 | 10 | 题目 Question · 详解 Mark Scheme |
| 2026 Jan | Q2 | 12 | 题目 Question · 详解 Mark Scheme |
| 2026 Jan 01A | Q3 | 11 | 题目 Question · 详解 Mark Scheme |
| 2026 Jan 01A | Q6 | 15 | 题目 Question · 详解 Mark Scheme |
| 2026 Jun 01A | Q2 | 11 | 题目 Question · 详解 Mark Scheme |
期望中位数与众数 Mean, median and mode (28 题)
方差与标准差 Variance and standard deviation (13 题)
| 试卷 Session | 题号 | 分值 | 链接 Links |
|---|---|---|---|
| 2019 Jun | Q5 | 19 | 题目 Question · 详解 Mark Scheme |
| 2020 Jan | Q6 | 8 | 题目 Question · 详解 Mark Scheme |
| 2020 Oct | Q5 | 13 | 题目 Question · 详解 Mark Scheme |
| 2021 Jun | Q3 | 15 | 题目 Question · 详解 Mark Scheme |
| 2022 Jan | Q2 | 8 | 题目 Question · 详解 Mark Scheme |
| 2023 Jan | Q6 | 18 | 题目 Question · 详解 Mark Scheme |
| 2024 Oct | Q7 | 15 | 题目 Question · 详解 Mark Scheme |
| 2025 Jan | Q4 | 10 | 题目 Question · 详解 Mark Scheme |
| 2025 Jun | Q5 | 11 | 题目 Question · 详解 Mark Scheme |
| 2025 Oct | Q7 | 12 | 题目 Question · 详解 Mark Scheme |
| 2026 Jan | Q6 | 19 | 题目 Question · 详解 Mark Scheme |
| 2026 Jan 01A | Q3 | 11 | 题目 Question · 详解 Mark Scheme |
| 2026 Jun | Q7 | 11 | 题目 Question · 详解 Mark Scheme |
E(g(X))与V(g(X)) E(g(X)) and V(g(X)) (11 题)
| 试卷 Session | 题号 | 分值 | 链接 Links |
|---|---|---|---|
| 2019 Oct | Q4 | 14 | 题目 Question · 详解 Mark Scheme |
| 2020 Jan | Q6 | 8 | 题目 Question · 详解 Mark Scheme |
| 2020 Oct | Q5 | 13 | 题目 Question · 详解 Mark Scheme |
| 2021 Jun | Q3 | 15 | 题目 Question · 详解 Mark Scheme |
| 2022 Jan | Q2 | 8 | 题目 Question · 详解 Mark Scheme |
| 2023 Jun | Q5 | 14 | 题目 Question · 详解 Mark Scheme |
| 2024 Jan | Q4 | 12 | 题目 Question · 详解 Mark Scheme |
| 2024 Jun | Q6 | 16 | 题目 Question · 详解 Mark Scheme |
| 2025 Jan | Q4 | 10 | 题目 Question · 详解 Mark Scheme |
| 2025 Oct | Q7 | 12 | 题目 Question · 详解 Mark Scheme |
| 2026 Jan | Q2 | 12 | 题目 Question · 详解 Mark Scheme |
分位数 Percentiles (9 题)
| 试卷 Session | 题号 | 分值 | 链接 Links |
|---|---|---|---|
| 2019 Oct | Q4 | 14 | 题目 Question · 详解 Mark Scheme |
| 2019 Oct | Q7 | 12 | 题目 Question · 详解 Mark Scheme |
| 2021 Jun | Q3 | 15 | 题目 Question · 详解 Mark Scheme |
| 2022 Oct | Q2 | 15 | 题目 Question · 详解 Mark Scheme |
| 2023 Jun | Q3 | 9 | 题目 Question · 详解 Mark Scheme |
| 2024 Jun | Q6 | 16 | 题目 Question · 详解 Mark Scheme |
| 2024 Oct | Q7 | 15 | 题目 Question · 详解 Mark Scheme |
| 2025 Jan | Q4 | 10 | 题目 Question · 详解 Mark Scheme |
| 2025 Jan | Q7 | 10 | 题目 Question · 详解 Mark Scheme |
偏态 Skewness (4 题)
| 试卷 Session | 题号 | 分值 | 链接 Links |
|---|---|---|---|
| 2022 Jan | Q4 | 15 | 题目 Question · 详解 Mark Scheme |
| 2025 Jun | Q1 | 11 | 题目 Question · 详解 Mark Scheme |
| 2025 Oct 01A | Q4 | 14 | 题目 Question · 详解 Mark Scheme |
| 2026 Jun 01A | Q2 | 11 | 题目 Question · 详解 Mark Scheme |
条件概率 Conditional probability (4 题)
| 试卷 Session | 题号 | 分值 | 链接 Links |
|---|---|---|---|
| 2022 Oct | Q5 | 9 | 题目 Question · 详解 Mark Scheme |
| 2023 Oct | Q6 | 12 | 题目 Question · 详解 Mark Scheme |
| 2024 Jan | Q4 | 12 | 题目 Question · 详解 Mark Scheme |
| 2024 Jun | Q2 | 9 | 题目 Question · 详解 Mark Scheme |
二项概率计算 Binomial probabilities (1 题)
| 试卷 Session | 题号 | 分值 | 链接 Links |
|---|---|---|---|
| 2025 Jan | Q4 | 10 | 题目 Question · 详解 Mark Scheme |
累积概率 Cumulative probabilities (1 题)
| 试卷 Session | 题号 | 分值 | 链接 Links |
|---|---|---|---|
| 2025 Jan | Q4 | 10 | 题目 Question · 详解 Mark Scheme |
时间空间单位换算 Scaling over time/space intervals (1 题)
| 试卷 Session | 题号 | 分值 | 链接 Links |
|---|---|---|---|
| 2026 Jan | Q6 | 19 | 题目 Question · 详解 Mark Scheme |
二项的正态近似 Normal approximation to the binomial (1 题)
| 试卷 Session | 题号 | 分值 | 链接 Links |
|---|---|---|---|
| 2022 Jun | Q2 | 11 | 题目 Question · 详解 Mark Scheme |
泊松的正态近似 Normal approximation to the Poisson (1 题)
| 试卷 Session | 题号 | 分值 | 链接 Links |
|---|---|---|---|
| 2026 Jan | Q6 | 19 | 题目 Question · 详解 Mark Scheme |
连续性修正 Continuity correction (2 题)
| 试卷 Session | 题号 | 分值 | 链接 Links |
|---|---|---|---|
| 2022 Jun | Q2 | 11 | 题目 Question · 详解 Mark Scheme |
| 2026 Jan | Q6 | 19 | 题目 Question · 详解 Mark Scheme |
二项假设检验 Hypothesis test for p (1 题)
| 试卷 Session | 题号 | 分值 | 链接 Links |
|---|---|---|---|
| 2019 Oct | Q7 | 12 | 题目 Question · 详解 Mark Scheme |
显著性水平与临界域 Significance levels and critical regions (1 题)
| 试卷 Session | 题号 | 分值 | 链接 Links |
|---|---|---|---|
| 2019 Oct | Q7 | 12 | 题目 Question · 详解 Mark Scheme |
4 · 连续均匀(矩形)分布 Continuous Uniform (Rectangular) Distribution (21 题)
均匀分布概率 Uniform probabilities (21 题)
| 试卷 Session | 题号 | 分值 | 链接 Links |
|---|---|---|---|
| 2019 Jan | Q5 | 13 | 题目 Question · 详解 Mark Scheme |
| 2019 Jun | Q3 | 7 | 题目 Question · 详解 Mark Scheme |
| 2019 Oct | Q2 | 9 | 题目 Question · 详解 Mark Scheme |
| 2020 Jan | Q3 | 10 | 题目 Question · 详解 Mark Scheme |
| 2020 Oct | Q2 | 12 | 题目 Question · 详解 Mark Scheme |
| 2021 Jun | Q5 | 11 | 题目 Question · 详解 Mark Scheme |
| 2022 Jan | Q7 | 8 | 题目 Question · 详解 Mark Scheme |
| 2022 Jun | Q3 | 10 | 题目 Question · 详解 Mark Scheme |
| 2022 Oct | Q7 | 12 | 题目 Question · 详解 Mark Scheme |
| 2023 Jan | Q4 | 10 | 题目 Question · 详解 Mark Scheme |
| 2023 Jun | Q6 | 12 | 题目 Question · 详解 Mark Scheme |
| 2023 Oct | Q3 | 9 | 题目 Question · 详解 Mark Scheme |
| 2024 Jan | Q5 | 10 | 题目 Question · 详解 Mark Scheme |
| 2024 Oct | Q4 | 9 | 题目 Question · 详解 Mark Scheme |
| 2025 Jan | Q3 | 15 | 题目 Question · 详解 Mark Scheme |
| 2025 Jun | Q6 | 10 | 题目 Question · 详解 Mark Scheme |
| 2025 Oct | Q6 | 10 | 题目 Question · 详解 Mark Scheme |
| 2025 Oct 01A | Q7 | 9 | 题目 Question · 详解 Mark Scheme |
| 2026 Jan 01A | Q5 | 11 | 题目 Question · 详解 Mark Scheme |
| 2026 Jun | Q2 | 12 | 题目 Question · 详解 Mark Scheme |
| 2026 Jun 01A | Q6 | 10 | 题目 Question · 详解 Mark Scheme |
均匀分布期望方差 Mean and variance of the uniform (17 题)
| 试卷 Session | 题号 | 分值 | 链接 Links |
|---|---|---|---|
| 2019 Jan | Q5 | 13 | 题目 Question · 详解 Mark Scheme |
| 2019 Jun | Q3 | 7 | 题目 Question · 详解 Mark Scheme |
| 2019 Oct | Q2 | 9 | 题目 Question · 详解 Mark Scheme |
| 2020 Jan | Q3 | 10 | 题目 Question · 详解 Mark Scheme |
| 2020 Oct | Q2 | 12 | 题目 Question · 详解 Mark Scheme |
| 2022 Jan | Q7 | 8 | 题目 Question · 详解 Mark Scheme |
| 2022 Oct | Q7 | 12 | 题目 Question · 详解 Mark Scheme |
| 2023 Jan | Q4 | 10 | 题目 Question · 详解 Mark Scheme |
| 2023 Jun | Q6 | 12 | 题目 Question · 详解 Mark Scheme |
| 2023 Oct | Q3 | 9 | 题目 Question · 详解 Mark Scheme |
| 2024 Jan | Q5 | 10 | 题目 Question · 详解 Mark Scheme |
| 2024 Oct | Q4 | 9 | 题目 Question · 详解 Mark Scheme |
| 2025 Jan | Q3 | 15 | 题目 Question · 详解 Mark Scheme |
| 2025 Jun | Q6 | 10 | 题目 Question · 详解 Mark Scheme |
| 2025 Oct 01A | Q7 | 9 | 题目 Question · 详解 Mark Scheme |
| 2026 Jun | Q2 | 12 | 题目 Question · 详解 Mark Scheme |
| 2026 Jun 01A | Q6 | 10 | 题目 Question · 详解 Mark Scheme |
均匀分布建模 Modelling with the uniform (9 题)
| 试卷 Session | 题号 | 分值 | 链接 Links |
|---|---|---|---|
| 2019 Jan | Q5 | 13 | 题目 Question · 详解 Mark Scheme |
| 2021 Jun | Q5 | 11 | 题目 Question · 详解 Mark Scheme |
| 2022 Jun | Q3 | 10 | 题目 Question · 详解 Mark Scheme |
| 2022 Oct | Q7 | 12 | 题目 Question · 详解 Mark Scheme |
| 2023 Oct | Q3 | 9 | 题目 Question · 详解 Mark Scheme |
| 2024 Jan | Q5 | 10 | 题目 Question · 详解 Mark Scheme |
| 2024 Oct | Q4 | 9 | 题目 Question · 详解 Mark Scheme |
| 2025 Oct | Q6 | 10 | 题目 Question · 详解 Mark Scheme |
| 2026 Jan 01A | Q5 | 11 | 题目 Question · 详解 Mark Scheme |
二项概率计算 Binomial probabilities (3 题)
| 试卷 Session | 题号 | 分值 | 链接 Links |
|---|---|---|---|
| 2020 Jan | Q3 | 10 | 题目 Question · 详解 Mark Scheme |
| 2020 Oct | Q2 | 12 | 题目 Question · 详解 Mark Scheme |
| 2021 Jun | Q5 | 11 | 题目 Question · 详解 Mark Scheme |
概率密度函数 Probability density function (3 题)
| 试卷 Session | 题号 | 分值 | 链接 Links |
|---|---|---|---|
| 2021 Jun | Q5 | 11 | 题目 Question · 详解 Mark Scheme |
| 2023 Oct | Q3 | 9 | 题目 Question · 详解 Mark Scheme |
| 2026 Jun | Q2 | 12 | 题目 Question · 详解 Mark Scheme |
累积分布函数 Cumulative distribution function (6 题)
| 试卷 Session | 题号 | 分值 | 链接 Links |
|---|---|---|---|
| 2019 Jun | Q3 | 7 | 题目 Question · 详解 Mark Scheme |
| 2020 Oct | Q2 | 12 | 题目 Question · 详解 Mark Scheme |
| 2021 Jun | Q5 | 11 | 题目 Question · 详解 Mark Scheme |
| 2022 Jun | Q3 | 10 | 题目 Question · 详解 Mark Scheme |
| 2025 Jan | Q3 | 15 | 题目 Question · 详解 Mark Scheme |
| 2026 Jun | Q2 | 12 | 题目 Question · 详解 Mark Scheme |
E(g(X))与V(g(X)) E(g(X)) and V(g(X)) (8 题)
| 试卷 Session | 题号 | 分值 | 链接 Links |
|---|---|---|---|
| 2022 Jan | Q7 | 8 | 题目 Question · 详解 Mark Scheme |
| 2022 Oct | Q7 | 12 | 题目 Question · 详解 Mark Scheme |
| 2023 Jan | Q4 | 10 | 题目 Question · 详解 Mark Scheme |
| 2023 Jun | Q6 | 12 | 题目 Question · 详解 Mark Scheme |
| 2025 Jan | Q3 | 15 | 题目 Question · 详解 Mark Scheme |
| 2025 Jun | Q6 | 10 | 题目 Question · 详解 Mark Scheme |
| 2025 Oct | Q6 | 10 | 题目 Question · 详解 Mark Scheme |
| 2025 Oct 01A | Q7 | 9 | 题目 Question · 详解 Mark Scheme |
分位数 Percentiles (1 题)
| 试卷 Session | 题号 | 分值 | 链接 Links |
|---|---|---|---|
| 2019 Oct | Q2 | 9 | 题目 Question · 详解 Mark Scheme |
5 · 正态近似 Normal Approximations (11 题)
二项的正态近似 Normal approximation to the binomial (10 题)
| 试卷 Session | 题号 | 分值 | 链接 Links |
|---|---|---|---|
| 2019 Jan | Q6 | 12 | 题目 Question · 详解 Mark Scheme |
| 2019 Oct | Q6 | 8 | 题目 Question · 详解 Mark Scheme |
| 2020 Oct | Q3 | 15 | 题目 Question · 详解 Mark Scheme |
| 2021 Jun | Q6 | 10 | 题目 Question · 详解 Mark Scheme |
| 2022 Oct | Q4 | 9 | 题目 Question · 详解 Mark Scheme |
| 2023 Jun | Q1 | 11 | 题目 Question · 详解 Mark Scheme |
| 2023 Oct | Q7 | 10 | 题目 Question · 详解 Mark Scheme |
| 2025 Jan | Q6 | 8 | 题目 Question · 详解 Mark Scheme |
| 2025 Oct 01A | Q3 | 11 | 题目 Question · 详解 Mark Scheme |
| 2026 Jan | Q7 | 10 | 题目 Question · 详解 Mark Scheme |
泊松的正态近似 Normal approximation to the Poisson (1 题)
| 试卷 Session | 题号 | 分值 | 链接 Links |
|---|---|---|---|
| 2023 Jan | Q5 | 14 | 题目 Question · 详解 Mark Scheme |
连续性修正 Continuity correction (11 题)
| 试卷 Session | 题号 | 分值 | 链接 Links |
|---|---|---|---|
| 2019 Jan | Q6 | 12 | 题目 Question · 详解 Mark Scheme |
| 2019 Oct | Q6 | 8 | 题目 Question · 详解 Mark Scheme |
| 2020 Oct | Q3 | 15 | 题目 Question · 详解 Mark Scheme |
| 2021 Jun | Q6 | 10 | 题目 Question · 详解 Mark Scheme |
| 2022 Oct | Q4 | 9 | 题目 Question · 详解 Mark Scheme |
| 2023 Jan | Q5 | 14 | 题目 Question · 详解 Mark Scheme |
| 2023 Jun | Q1 | 11 | 题目 Question · 详解 Mark Scheme |
| 2023 Oct | Q7 | 10 | 题目 Question · 详解 Mark Scheme |
| 2025 Jan | Q6 | 8 | 题目 Question · 详解 Mark Scheme |
| 2025 Oct 01A | Q3 | 11 | 题目 Question · 详解 Mark Scheme |
| 2026 Jan | Q7 | 10 | 题目 Question · 详解 Mark Scheme |
二项概率计算 Binomial probabilities (7 题)
| 试卷 Session | 题号 | 分值 | 链接 Links |
|---|---|---|---|
| 2019 Oct | Q6 | 8 | 题目 Question · 详解 Mark Scheme |
| 2020 Oct | Q3 | 15 | 题目 Question · 详解 Mark Scheme |
| 2022 Oct | Q4 | 9 | 题目 Question · 详解 Mark Scheme |
| 2023 Jan | Q5 | 14 | 题目 Question · 详解 Mark Scheme |
| 2023 Jun | Q1 | 11 | 题目 Question · 详解 Mark Scheme |
| 2025 Oct 01A | Q3 | 11 | 题目 Question · 详解 Mark Scheme |
| 2026 Jan | Q7 | 10 | 题目 Question · 详解 Mark Scheme |
累积概率 Cumulative probabilities (5 题)
| 试卷 Session | 题号 | 分值 | 链接 Links |
|---|---|---|---|
| 2019 Oct | Q6 | 8 | 题目 Question · 详解 Mark Scheme |
| 2020 Oct | Q3 | 15 | 题目 Question · 详解 Mark Scheme |
| 2022 Oct | Q4 | 9 | 题目 Question · 详解 Mark Scheme |
| 2023 Jun | Q1 | 11 | 题目 Question · 详解 Mark Scheme |
| 2026 Jan | Q7 | 10 | 题目 Question · 详解 Mark Scheme |
二项期望与方差 Mean and variance of B(n,p) (2 题)
| 试卷 Session | 题号 | 分值 | 链接 Links |
|---|---|---|---|
| 2021 Jun | Q6 | 10 | 题目 Question · 详解 Mark Scheme |
| 2025 Jan | Q6 | 8 | 题目 Question · 详解 Mark Scheme |
泊松概率计算 Poisson probabilities (1 题)
| 试卷 Session | 题号 | 分值 | 链接 Links |
|---|---|---|---|
| 2023 Jan | Q5 | 14 | 题目 Question · 详解 Mark Scheme |
时间空间单位换算 Scaling over time/space intervals (1 题)
| 试卷 Session | 题号 | 分值 | 链接 Links |
|---|---|---|---|
| 2023 Jan | Q5 | 14 | 题目 Question · 详解 Mark Scheme |
泊松近似二项 Poisson approximation to the binomial (2 题)
| 试卷 Session | 题号 | 分值 | 链接 Links |
|---|---|---|---|
| 2019 Jan | Q6 | 12 | 题目 Question · 详解 Mark Scheme |
| 2025 Oct 01A | Q3 | 11 | 题目 Question · 详解 Mark Scheme |
均匀分布概率 Uniform probabilities (1 题)
| 试卷 Session | 题号 | 分值 | 链接 Links |
|---|---|---|---|
| 2019 Oct | Q6 | 8 | 题目 Question · 详解 Mark Scheme |
统计量与抽样分布 Statistics and sampling distributions (1 题)
| 试卷 Session | 题号 | 分值 | 链接 Links |
|---|---|---|---|
| 2019 Jan | Q6 | 12 | 题目 Question · 详解 Mark Scheme |
抽样方法 Sampling methods (1 题)
| 试卷 Session | 题号 | 分值 | 链接 Links |
|---|---|---|---|
| 2019 Jan | Q6 | 12 | 题目 Question · 详解 Mark Scheme |
二项假设检验 Hypothesis test for p (1 题)
| 试卷 Session | 题号 | 分值 | 链接 Links |
|---|---|---|---|
| 2020 Oct | Q3 | 15 | 题目 Question · 详解 Mark Scheme |
显著性水平与临界域 Significance levels and critical regions (1 题)
| 试卷 Session | 题号 | 分值 | 链接 Links |
|---|---|---|---|
| 2020 Oct | Q3 | 15 | 题目 Question · 详解 Mark Scheme |
6 · 种群与抽样 Populations and Samples (22 题)
统计量与抽样分布 Statistics and sampling distributions (20 题)
| 试卷 Session | 题号 | 分值 | 链接 Links |
|---|---|---|---|
| 2019 Jun | Q2 | 6 | 题目 Question · 详解 Mark Scheme |
| 2019 Oct | Q5 | 11 | 题目 Question · 详解 Mark Scheme |
| 2020 Oct | Q6 | 11 | 题目 Question · 详解 Mark Scheme |
| 2021 Jun | Q4 | 10 | 题目 Question · 详解 Mark Scheme |
| 2022 Jan | Q6 | 10 | 题目 Question · 详解 Mark Scheme |
| 2022 Jun | Q7 | 12 | 题目 Question · 详解 Mark Scheme |
| 2022 Oct | Q6 | 9 | 题目 Question · 详解 Mark Scheme |
| 2023 Jan | Q2 | 11 | 题目 Question · 详解 Mark Scheme |
| 2023 Jun | Q2 | 4 | 题目 Question · 详解 Mark Scheme |
| 2023 Oct | Q4 | 10 | 题目 Question · 详解 Mark Scheme |
| 2024 Jan | Q6 | 9 | 题目 Question · 详解 Mark Scheme |
| 2024 Jun | Q4 | 10 | 题目 Question · 详解 Mark Scheme |
| 2024 Oct | Q6 | 11 | 题目 Question · 详解 Mark Scheme |
| 2025 Jan | Q2 | 11 | 题目 Question · 详解 Mark Scheme |
| 2025 Jun | Q4 | 9 | 题目 Question · 详解 Mark Scheme |
| 2025 Oct | Q3 | 13 | 题目 Question · 详解 Mark Scheme |
| 2025 Oct 01A | Q6 | 9 | 题目 Question · 详解 Mark Scheme |
| 2026 Jan | Q5 | 10 | 题目 Question · 详解 Mark Scheme |
| 2026 Jun | Q4 | 10 | 题目 Question · 详解 Mark Scheme |
| 2026 Jun 01A | Q5 | 13 | 题目 Question · 详解 Mark Scheme |
总体与样本 Populations and samples (13 题)
| 试卷 Session | 题号 | 分值 | 链接 Links |
|---|---|---|---|
| 2020 Oct | Q6 | 11 | 题目 Question · 详解 Mark Scheme |
| 2022 Jan | Q6 | 10 | 题目 Question · 详解 Mark Scheme |
| 2022 Jun | Q7 | 12 | 题目 Question · 详解 Mark Scheme |
| 2022 Oct | Q6 | 9 | 题目 Question · 详解 Mark Scheme |
| 2023 Jan | Q2 | 11 | 题目 Question · 详解 Mark Scheme |
| 2023 Jun | Q2 | 4 | 题目 Question · 详解 Mark Scheme |
| 2023 Oct | Q4 | 10 | 题目 Question · 详解 Mark Scheme |
| 2024 Jan | Q6 | 9 | 题目 Question · 详解 Mark Scheme |
| 2024 Jun | Q4 | 10 | 题目 Question · 详解 Mark Scheme |
| 2024 Oct | Q6 | 11 | 题目 Question · 详解 Mark Scheme |
| 2025 Jan | Q2 | 11 | 题目 Question · 详解 Mark Scheme |
| 2025 Oct | Q1 | 4 | 题目 Question · 详解 Mark Scheme |
| 2026 Jun | Q1 | 4 | 题目 Question · 详解 Mark Scheme |
抽样方法 Sampling methods (3 题)
| 试卷 Session | 题号 | 分值 | 链接 Links |
|---|---|---|---|
| 2023 Jun | Q2 | 4 | 题目 Question · 详解 Mark Scheme |
| 2025 Oct | Q1 | 4 | 题目 Question · 详解 Mark Scheme |
| 2026 Jun | Q1 | 4 | 题目 Question · 详解 Mark Scheme |
二项概率计算 Binomial probabilities (4 题)
| 试卷 Session | 题号 | 分值 | 链接 Links |
|---|---|---|---|
| 2024 Jan | Q6 | 9 | 题目 Question · 详解 Mark Scheme |
| 2024 Jun | Q4 | 10 | 题目 Question · 详解 Mark Scheme |
| 2025 Jun | Q4 | 9 | 题目 Question · 详解 Mark Scheme |
| 2026 Jun 01A | Q5 | 13 | 题目 Question · 详解 Mark Scheme |
累积概率 Cumulative probabilities (2 题)
| 试卷 Session | 题号 | 分值 | 链接 Links |
|---|---|---|---|
| 2025 Jun | Q4 | 9 | 题目 Question · 详解 Mark Scheme |
| 2026 Jun 01A | Q5 | 13 | 题目 Question · 详解 Mark Scheme |
二项期望与方差 Mean and variance of B(n,p) (1 题)
| 试卷 Session | 题号 | 分值 | 链接 Links |
|---|---|---|---|
| 2022 Jun | Q7 | 12 | 题目 Question · 详解 Mark Scheme |
7 · 假设检验 Hypothesis Testing (23 题)
二项假设检验 Hypothesis test for p (13 题)
| 试卷 Session | 题号 | 分值 | 链接 Links |
|---|---|---|---|
| 2019 Jan | Q4 | 9 | 题目 Question · 详解 Mark Scheme |
| 2021 Jun | Q1 | 14 | 题目 Question · 详解 Mark Scheme |
| 2022 Jan | Q5 | 14 | 题目 Question · 详解 Mark Scheme |
| 2022 Jun | Q4 | 9 | 题目 Question · 详解 Mark Scheme |
| 2022 Oct | Q3 | 10 | 题目 Question · 详解 Mark Scheme |
| 2023 Jan | Q3 | 11 | 题目 Question · 详解 Mark Scheme |
| 2023 Jun | Q4 | 13 | 题目 Question · 详解 Mark Scheme |
| 2024 Jan | Q3 | 12 | 题目 Question · 详解 Mark Scheme |
| 2024 Jun | Q3 | 15 | 题目 Question · 详解 Mark Scheme |
| 2025 Oct 01A | Q2 | 9 | 题目 Question · 详解 Mark Scheme |
| 2026 Jan | Q4 | 8 | 题目 Question · 详解 Mark Scheme |
| 2026 Jan 01A | Q4 | 7 | 题目 Question · 详解 Mark Scheme |
| 2026 Jun 01A | Q4 | 12 | 题目 Question · 详解 Mark Scheme |
泊松假设检验 Hypothesis test for the Poisson mean (10 题)
| 试卷 Session | 题号 | 分值 | 链接 Links |
|---|---|---|---|
| 2019 Jun | Q4 | 8 | 题目 Question · 详解 Mark Scheme |
| 2019 Oct | Q3 | 12 | 题目 Question · 详解 Mark Scheme |
| 2020 Jan | Q5 | 13 | 题目 Question · 详解 Mark Scheme |
| 2022 Jan | Q3 | 9 | 题目 Question · 详解 Mark Scheme |
| 2023 Oct | Q5 | 16 | 题目 Question · 详解 Mark Scheme |
| 2024 Oct | Q3 | 11 | 题目 Question · 详解 Mark Scheme |
| 2025 Jan | Q5 | 10 | 题目 Question · 详解 Mark Scheme |
| 2025 Jun | Q2 | 10 | 题目 Question · 详解 Mark Scheme |
| 2025 Oct | Q2 | 12 | 题目 Question · 详解 Mark Scheme |
| 2026 Jan | Q3 | 9 | 题目 Question · 详解 Mark Scheme |
双侧检验 Two-tailed tests (12 题)
| 试卷 Session | 题号 | 分值 | 链接 Links |
|---|---|---|---|
| 2019 Jun | Q4 | 8 | 题目 Question · 详解 Mark Scheme |
| 2020 Jan | Q5 | 13 | 题目 Question · 详解 Mark Scheme |
| 2022 Jan | Q3 | 9 | 题目 Question · 详解 Mark Scheme |
| 2022 Jun | Q4 | 9 | 题目 Question · 详解 Mark Scheme |
| 2022 Oct | Q3 | 10 | 题目 Question · 详解 Mark Scheme |
| 2024 Jan | Q3 | 12 | 题目 Question · 详解 Mark Scheme |
| 2024 Jun | Q3 | 15 | 题目 Question · 详解 Mark Scheme |
| 2024 Oct | Q3 | 11 | 题目 Question · 详解 Mark Scheme |
| 2025 Jun | Q2 | 10 | 题目 Question · 详解 Mark Scheme |
| 2026 Jan | Q4 | 8 | 题目 Question · 详解 Mark Scheme |
| 2026 Jan 01A | Q4 | 7 | 题目 Question · 详解 Mark Scheme |
| 2026 Jun 01A | Q4 | 12 | 题目 Question · 详解 Mark Scheme |
显著性水平与临界域 Significance levels and critical regions (19 题)
| 试卷 Session | 题号 | 分值 | 链接 Links |
|---|---|---|---|
| 2019 Jan | Q4 | 9 | 题目 Question · 详解 Mark Scheme |
| 2019 Jun | Q4 | 8 | 题目 Question · 详解 Mark Scheme |
| 2019 Oct | Q3 | 12 | 题目 Question · 详解 Mark Scheme |
| 2020 Jan | Q5 | 13 | 题目 Question · 详解 Mark Scheme |
| 2021 Jun | Q1 | 14 | 题目 Question · 详解 Mark Scheme |
| 2022 Jan | Q3 | 9 | 题目 Question · 详解 Mark Scheme |
| 2022 Jan | Q5 | 14 | 题目 Question · 详解 Mark Scheme |
| 2022 Jun | Q4 | 9 | 题目 Question · 详解 Mark Scheme |
| 2022 Oct | Q3 | 10 | 题目 Question · 详解 Mark Scheme |
| 2023 Jan | Q3 | 11 | 题目 Question · 详解 Mark Scheme |
| 2023 Jun | Q4 | 13 | 题目 Question · 详解 Mark Scheme |
| 2024 Jan | Q3 | 12 | 题目 Question · 详解 Mark Scheme |
| 2024 Jun | Q3 | 15 | 题目 Question · 详解 Mark Scheme |
| 2024 Oct | Q3 | 11 | 题目 Question · 详解 Mark Scheme |
| 2025 Jan | Q5 | 10 | 题目 Question · 详解 Mark Scheme |
| 2025 Jun | Q2 | 10 | 题目 Question · 详解 Mark Scheme |
| 2026 Jan | Q3 | 9 | 题目 Question · 详解 Mark Scheme |
| 2026 Jan 01A | Q4 | 7 | 题目 Question · 详解 Mark Scheme |
| 2026 Jun 01A | Q4 | 12 | 题目 Question · 详解 Mark Scheme |
二项概率计算 Binomial probabilities (3 题)
| 试卷 Session | 题号 | 分值 | 链接 Links |
|---|---|---|---|
| 2021 Jun | Q1 | 14 | 题目 Question · 详解 Mark Scheme |
| 2023 Jan | Q3 | 11 | 题目 Question · 详解 Mark Scheme |
| 2026 Jan | Q4 | 8 | 题目 Question · 详解 Mark Scheme |
累积概率 Cumulative probabilities (3 题)
| 试卷 Session | 题号 | 分值 | 链接 Links |
|---|---|---|---|
| 2021 Jun | Q1 | 14 | 题目 Question · 详解 Mark Scheme |
| 2023 Jan | Q3 | 11 | 题目 Question · 详解 Mark Scheme |
| 2026 Jan | Q4 | 8 | 题目 Question · 详解 Mark Scheme |
二项期望与方差 Mean and variance of B(n,p) (1 题)
| 试卷 Session | 题号 | 分值 | 链接 Links |
|---|---|---|---|
| 2019 Jan | Q4 | 9 | 题目 Question · 详解 Mark Scheme |
二项建模 Modelling with the binomial (3 题)
| 试卷 Session | 题号 | 分值 | 链接 Links |
|---|---|---|---|
| 2022 Jan | Q5 | 14 | 题目 Question · 详解 Mark Scheme |
| 2024 Jan | Q3 | 12 | 题目 Question · 详解 Mark Scheme |
| 2026 Jun 01A | Q4 | 12 | 题目 Question · 详解 Mark Scheme |
泊松概率计算 Poisson probabilities (6 题)
| 试卷 Session | 题号 | 分值 | 链接 Links |
|---|---|---|---|
| 2019 Oct | Q3 | 12 | 题目 Question · 详解 Mark Scheme |
| 2020 Jan | Q5 | 13 | 题目 Question · 详解 Mark Scheme |
| 2023 Oct | Q5 | 16 | 题目 Question · 详解 Mark Scheme |
| 2025 Jan | Q5 | 10 | 题目 Question · 详解 Mark Scheme |
| 2025 Oct | Q2 | 12 | 题目 Question · 详解 Mark Scheme |
| 2026 Jan | Q3 | 9 | 题目 Question · 详解 Mark Scheme |
时间空间单位换算 Scaling over time/space intervals (7 题)
| 试卷 Session | 题号 | 分值 | 链接 Links |
|---|---|---|---|
| 2019 Jun | Q4 | 8 | 题目 Question · 详解 Mark Scheme |
| 2019 Oct | Q3 | 12 | 题目 Question · 详解 Mark Scheme |
| 2020 Jan | Q5 | 13 | 题目 Question · 详解 Mark Scheme |
| 2025 Jan | Q5 | 10 | 题目 Question · 详解 Mark Scheme |
| 2025 Jun | Q2 | 10 | 题目 Question · 详解 Mark Scheme |
| 2025 Oct | Q2 | 12 | 题目 Question · 详解 Mark Scheme |
| 2026 Jan | Q3 | 9 | 题目 Question · 详解 Mark Scheme |
泊松近似二项 Poisson approximation to the binomial (3 题)
| 试卷 Session | 题号 | 分值 | 链接 Links |
|---|---|---|---|
| 2022 Jan | Q5 | 14 | 题目 Question · 详解 Mark Scheme |
| 2023 Jun | Q4 | 13 | 题目 Question · 详解 Mark Scheme |
| 2026 Jan | Q4 | 8 | 题目 Question · 详解 Mark Scheme |
泊松期望与方差 Mean and variance of Poisson (1 题)
| 试卷 Session | 题号 | 分值 | 链接 Links |
|---|---|---|---|
| 2025 Oct | Q2 | 12 | 题目 Question · 详解 Mark Scheme |
泊松建模 Modelling with the Poisson (4 题)
| 试卷 Session | 题号 | 分值 | 链接 Links |
|---|---|---|---|
| 2022 Jan | Q3 | 9 | 题目 Question · 详解 Mark Scheme |
| 2023 Oct | Q5 | 16 | 题目 Question · 详解 Mark Scheme |
| 2024 Oct | Q3 | 11 | 题目 Question · 详解 Mark Scheme |
| 2025 Jun | Q2 | 10 | 题目 Question · 详解 Mark Scheme |
二项的正态近似 Normal approximation to the binomial (5 题)
| 试卷 Session | 题号 | 分值 | 链接 Links |
|---|---|---|---|
| 2021 Jun | Q1 | 14 | 题目 Question · 详解 Mark Scheme |
| 2022 Jan | Q5 | 14 | 题目 Question · 详解 Mark Scheme |
| 2022 Jun | Q4 | 9 | 题目 Question · 详解 Mark Scheme |
| 2022 Oct | Q3 | 10 | 题目 Question · 详解 Mark Scheme |
| 2024 Jun | Q3 | 15 | 题目 Question · 详解 Mark Scheme |
泊松的正态近似 Normal approximation to the Poisson (2 题)
| 试卷 Session | 题号 | 分值 | 链接 Links |
|---|---|---|---|
| 2019 Oct | Q3 | 12 | 题目 Question · 详解 Mark Scheme |
| 2023 Oct | Q5 | 16 | 题目 Question · 详解 Mark Scheme |
连续性修正 Continuity correction (6 题)
| 试卷 Session | 题号 | 分值 | 链接 Links |
|---|---|---|---|
| 2021 Jun | Q1 | 14 | 题目 Question · 详解 Mark Scheme |
| 2022 Jan | Q5 | 14 | 题目 Question · 详解 Mark Scheme |
| 2022 Jun | Q4 | 9 | 题目 Question · 详解 Mark Scheme |
| 2022 Oct | Q3 | 10 | 题目 Question · 详解 Mark Scheme |
| 2023 Oct | Q5 | 16 | 题目 Question · 详解 Mark Scheme |
| 2024 Jun | Q3 | 15 | 题目 Question · 详解 Mark Scheme |
总体与样本 Populations and samples (2 题)
| 试卷 Session | 题号 | 分值 | 链接 Links |
|---|---|---|---|
| 2024 Jun | Q3 | 15 | 题目 Question · 详解 Mark Scheme |
| 2025 Oct 01A | Q2 | 9 | 题目 Question · 详解 Mark Scheme |
抽样方法 Sampling methods (2 题)
| 试卷 Session | 题号 | 分值 | 链接 Links |
|---|---|---|---|
| 2024 Jun | Q3 | 15 | 题目 Question · 详解 Mark Scheme |
| 2025 Oct 01A | Q2 | 9 | 题目 Question · 详解 Mark Scheme |
真题版权归 Pearson Edexcel 所有,此处仅作教学练习用途。
同一考季只保留一条链接:QP(试卷)/ MS(评分表)优先用 Pearson 官方直链,官方未公开该考季时才回退到第三方镜像 PMT(physicsandmathstutor.com,链接带 <em>PMT</em> 小标签);MA(Model Answers 详解)仅 PMT 有,ER(Examiner Report 考官报告)仅官方有。
⚠️ October 2025 / January 2026 / June 2026 三个考季:官方材料已上传但锁在教师账号后(访问跳登录页),第三方也尚未收录——本站不提供这三个考季的链接,需要请登录 Pearson 官方 course materials 页或经所在 centre 获取。
同一次考试可能有多个版本(如 Unit 1 与 Unit 1A),另有少量“(Unused)”备用卷,以表中实际列为准。
📄 Statistics 2(WST02)· 历年真题与评分材料
| 考季 | 试卷 QP | 评分表 MS | 详解 MA | 考官报告 ER |
|---|---|---|---|---|
| January 2019 | QP PMT | MS PMT | MA PMT | – |
| October 2020 | QP PMT | MS PMT | – | ER |
| January 2021 | QP PMT | MS PMT | – | – |
| June 2021 | QP PMT | MS | – | – |
| October 2021 | QP | MS | – | – |
| January 2022 | QP PMT | MS | – | – |
| June 2022 | QP | MS | – | ER |
| October 2022 | QP | MS | – | ER |
| January 2023 | QP | MS | – | ER |
| June 2023 | QP | MS | – | ER |
| October 2023 | QP | MS | – | ER |
| January 2024 | QP | MS | – | ER |
| June 2024 | QP | MS | – | ER |
| October 2024 | QP | MS | – | ER |
| January 2025 | QP | MS | – | ER |
| June 2025 | QP | MS | – | ER |
本单元索引页:PMT https://www.physicsandmathstutor.com/a-level-maths-papers/edexcel-maths-ial-papers/; Pearson 官方 Mathematics (2018) course materials(需教师账号的考季也在这里登录获取)。
QP = Question paper 试卷 · MS = Mark scheme 评分表 · MA = Model answers 详解 · ER = Examiner report 考官报告。 未带小标签的为 **Pearson 官方**直链;带 PMT 小标签的为第三方镜像(physicsandmathstutor.com)。 同一考季同一文档只保留一条链接,官方优先。全部链接 2026-10-15 逐条实测可下载。